I've Spotted Some 'Leakage' in This Market
Entering June, it doesn’t feel like a lot of selling is going on, but that doesn't mean there is buying interest either. Let's dive into the indicators, sentiment, VIX options and so much more.
You've reached your free article limit
You've read 0 of 1 free Pro articles.
For the last week or so, since the market got intermediate-term overbought, I have said I expect the market to be more volatile. I have also said in order to be bearish we need to see signs that there is aggressive selling.
Right now the easiest way for me to describe the market is that there isn’t much buying or selling. For the last two weeks we’ve seen one big up day followed by leakage in most stocks. The breadth of the market has been red for seven of the last 10 trading days. It doesn’t feel like selling, but leakage, as if there is little buying interest. It reminds me of that old adage that it takes real buying to push the market higher but stocks can fall of their own weight.
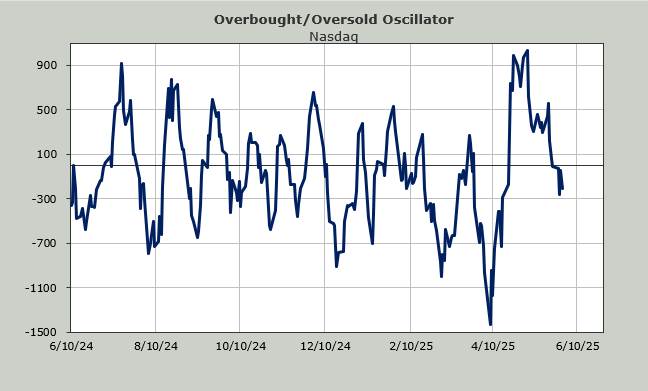
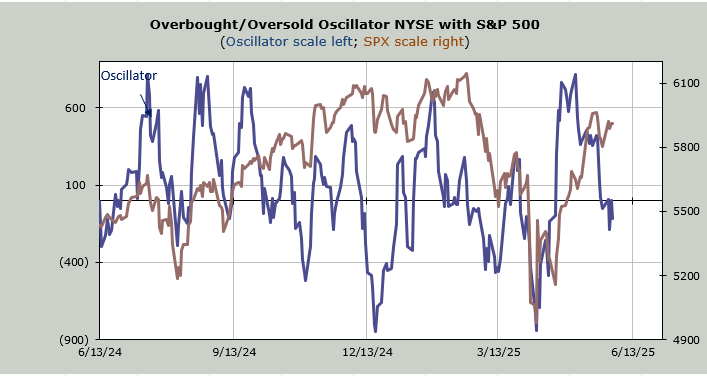
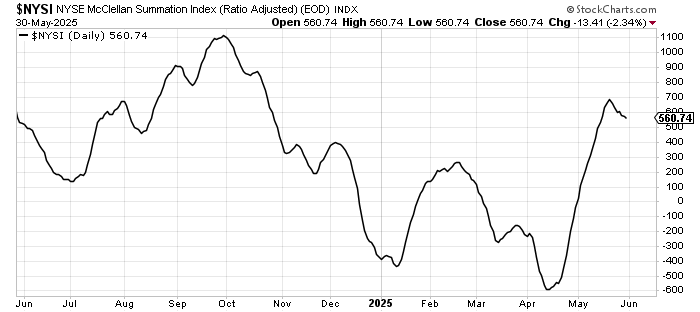
The intermediate-term indicators remain overbought. The Volume Indicator is at 54% (overbought is mid-to-upper 50s). The 30-day moving average of the advance/decline line is overbought. The Hi-Lo indicator is pointing down. The McClellan Summation Index is heading down. Yet there is nothing aggressive about it. For example, the Summation Index needs just +800 advancers minus decliners to halt the decline. For me, anything under +/- 1,000 is not a big deal because one day of trading can change that.
But let’s dive into the sentiment indicators because with the exception of the surveys they show folks are complacent. The surveys show no such thing, though, with more bears than bulls in most surveys (NAAIM is the exception with their exposure at 88, the highest since early March).
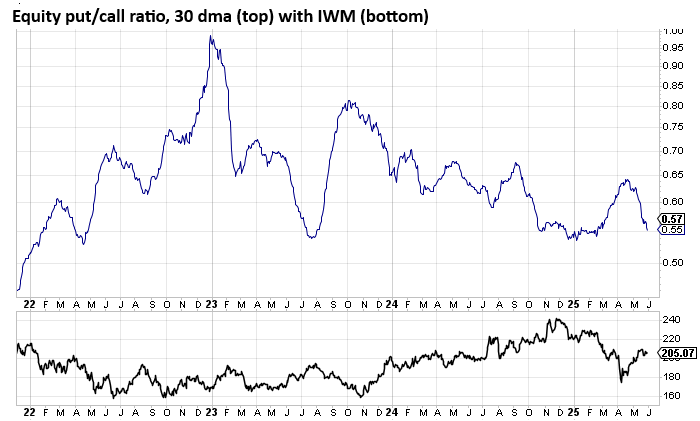
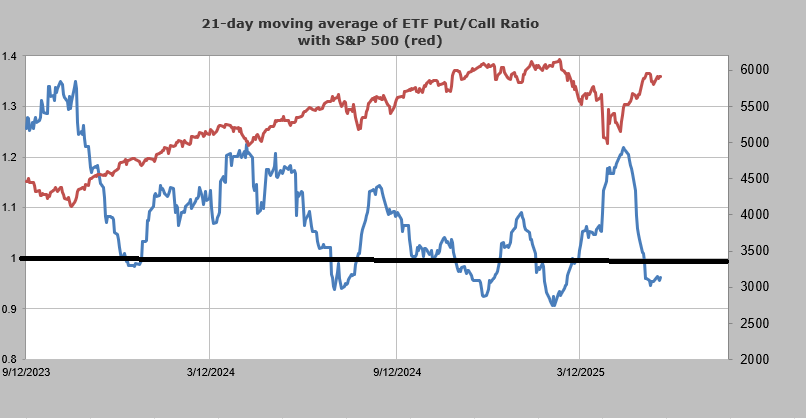
The 10-day moving average of the equity put/call ratio is low. But if we move out to the 30-day moving average, which moves more slowly, it too is showing complacency, although it has yet to turn back up.
I also like to separate out the put/call ratio for ETFs and here I use a 21-day moving average. When it goes under 1.0 it shows complacency.
Then there was last Thursday when the folks who trade the VIX options got quite aggressive with their call buying. The ratio came down to 0.15. I tend to use 0.20 as my line in the sand, meaning under 0.20 tells me the call buyers have gotten aggressive. When it comes to this particular options ratio I consider these folks pros and therefore the reading is not contrarian. Thus, the pros have joined me in looking for a higher level of volatility coming our way. The last time they bought call options to this extent (with the reading sub 0.20) was late January.
You might recall that the market did not go down after that. Rather we had one more push up to a higher high. But by mid-February their VIX call buying panned out.
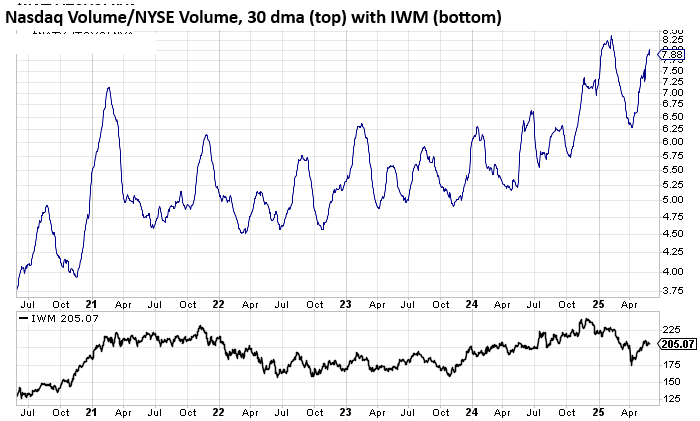
One final sign of sentiment is these penny stock trades I keep highlighting. They don’t occur daily but they have been often enough where the ratio of Nasdaq’s volume to the NYSE (set on a 30-day moving average) is challenging the late January high.
For now I still think we are in for a higher level of volatility but if the selling becomes aggressive I will look for more than just that.