It's Friday the 13th. Are Investors About to Panic?
Every 11 years, there are consecutive Friday the 13ths in February and March. But this year, will we see investors run for the exits?
You've reached your free article limit
You've read 0 of 1 free Pro articles.
 We're Adjusting Our Panic Points on 6 Stocks Reflecting Continued Strength
As I typed the date of this column, it occurred to me that we also had a Friday the 13th in February. Naturally, I Googled it to see how often that happens, two consecutive Friday the 13ths.
It turns out it’s quite rare, but it does occur every eleven years, and never in a Leap Year, and always in the months of February and March. Of course, I looked back to see if there was any market correlation. I can make one up, but alas, there was not much there to speak of!
So, we can’t blame the market’s decline on that. But it seems folks have found the culprit. Oh, sure, you already know it’s energy. But it seems on Thursday, they discovered how terrible the financials have been. As a reminder, folks came into the year very bullish on financials, and for the most part, they have been terrible all year, with most bank stocks down 20% or more by now.
On Thursday, it was as if market participants woke up from their slumber and saw the financials and banks and decided this is not good. I have been harping away about them for months, but somehow, Thursday was the day others realized there is a problem.
Was it enough to cause panic? Not at all. In fact, volume has gotten lighter, not heavier. The selling is more persistent than it is panicky. And that is what we see in the indicators as well.
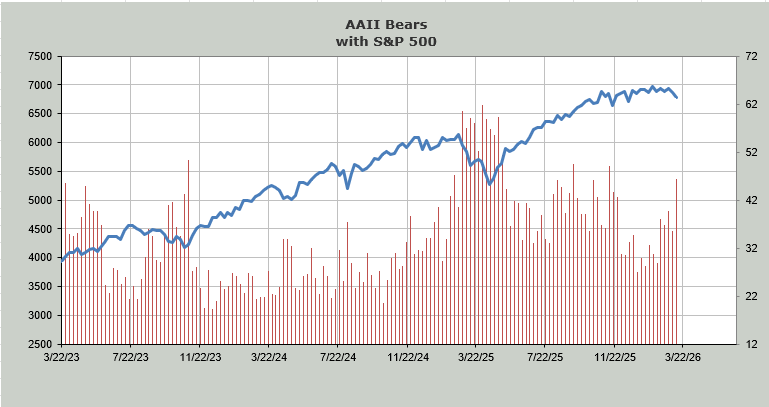
The AAII folks joined the Investors’ Intelligence folks (shown here yesterday) in pulling back their horns. Similar to the II folks, the AAII bulls stayed mostly steady, but the bears shot up. In this case, it was eleven points. It is not extreme, but it is moving in that direction with 46% bears now.
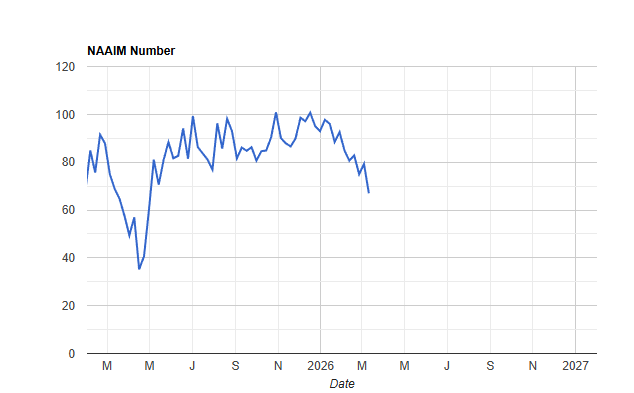
The NAAIM folks, too, pulled in their bullish horns. In December, their exposure was just a smidge over 100 (on margin). Now it’s down to 67, which is the lowest since the panic low of April 2025. Again, not extreme, but finally some movement off that complacency we were in for so long.
Many of you will see the Overbought/Oversold Oscillator nearing the April 2025 lows and say this is oversold. It is getting there. Remember that I look back ten days (this is a ten-day moving average of the net of the advance/decline line) to see when we are dropping a long string of negative breadth readings. The last six trading days’ breadth has been red. And for seven out of eight, it has been red. That means next week we’ll be short-term oversold.
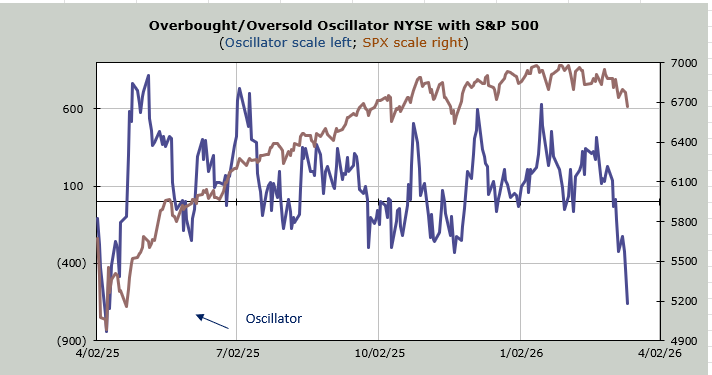
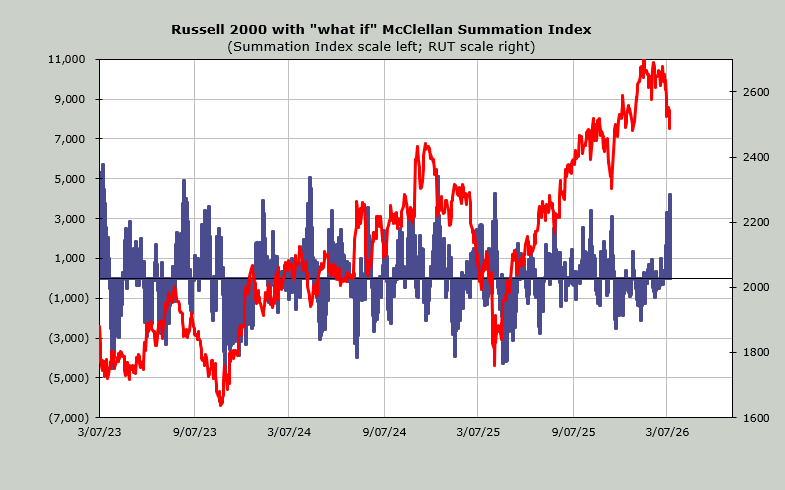
The McClellan Summation Index is heading down, and it has picked up some downside momentum this week. It will now require a net differential of +4200 advancers minus decliners on the NYSE to halt the decline. That makes this indicator oversold (over +4000, and it steps a toe into oversold territory).
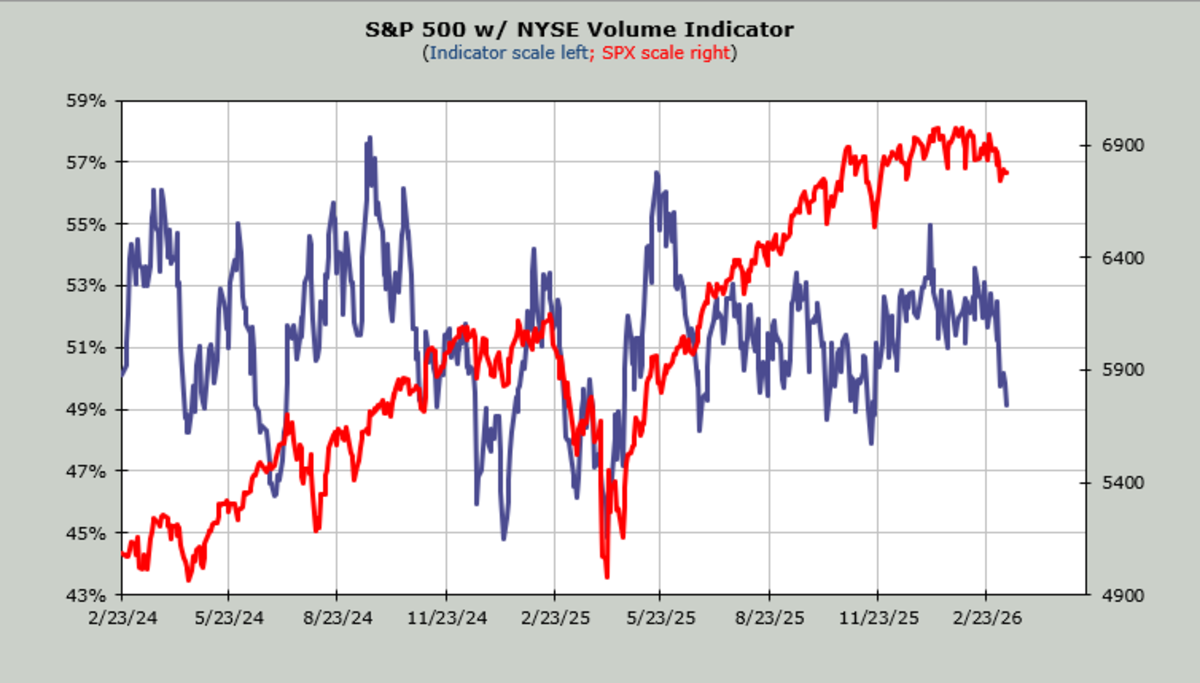
The intermediate-term indicators are not oversold. They are heading that way. For example, the Volume Indicator is at 49%. In bull markets, it gets oversold at 47%. In bear markets, it comes down to the low 40s.
We’ve finally gotten some movement on the indicators in the last few days. We’ve gotten some movement on sentiment, too. We’ll get to a point where everything lines up again; we always do. Patience.
Lastly, I had a chat with the folks at Tastytrade on sentiment. You can watch it here:
Related: Oil Shock Exposes Asia’s Weakest Links: Which Nations Are Most at Risk?
