Is Volume Quietly Screaming About the Next Big Move?
Trading volume is down, but this volume-based ratio could give us some good clues.
You've reached your free article limit
You've read 0 of 1 free Pro articles.
Wednesday was a big fat nothing day in the market.
Oh, sure, if I want to make a big deal out of it, I can say that despite bonds finally rallying (and rates falling), stocks mostly yawned. Wasn’t the narrative just the other day something about how the market needed rates lower? Okay, maybe that is always the cry of investors!
But the bonds did rally, and they rallied well, but stocks chopped.
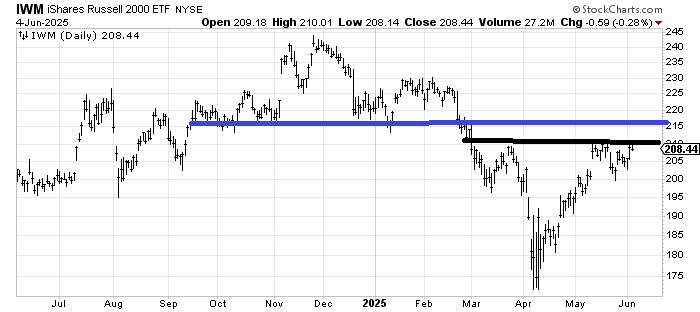
Again, I saw lots of chatter about folks being bullish and calling for melt-ups, and you know everyone sees my favorite pattern in the IWM: a head and shoulders bottom. As I noted over two weeks ago, before it developed, that if we pulled back, it would look like that.
As much as I love that pattern (who wouldn’t?), it’s the indicators that I find more important. I would also remind you that I have been eyeing that 215 resistance level on IWM for a long time now, and it still hasn’t been able to get there (blue line).
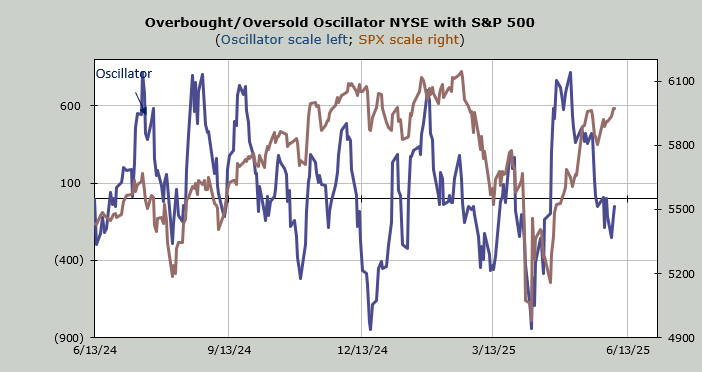
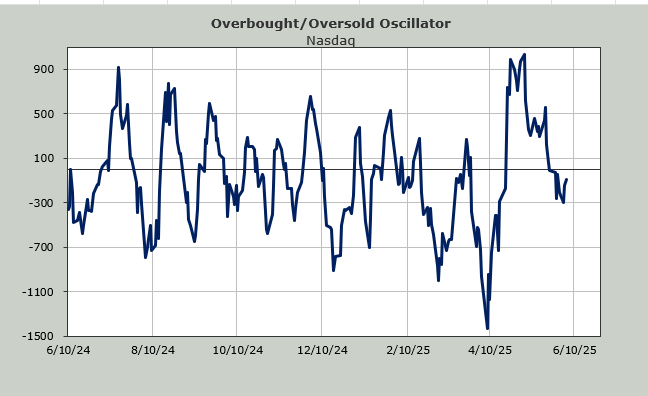
So did the indicators change on Wednesday? They did not. Well, one indicator changed. Volume. I noted this week that Nasdaq’s volume has really tailed off, with the lowest reading in weeks. The penny stock speculation has died down as well.
I am not one who thinks we must rally on higher volume. I have seen too many times where we rally just fine on light volume. I am, however, a stickler when it comes to declines: I like to see high volume on declines because I believe it indicates panic and cleanouts.
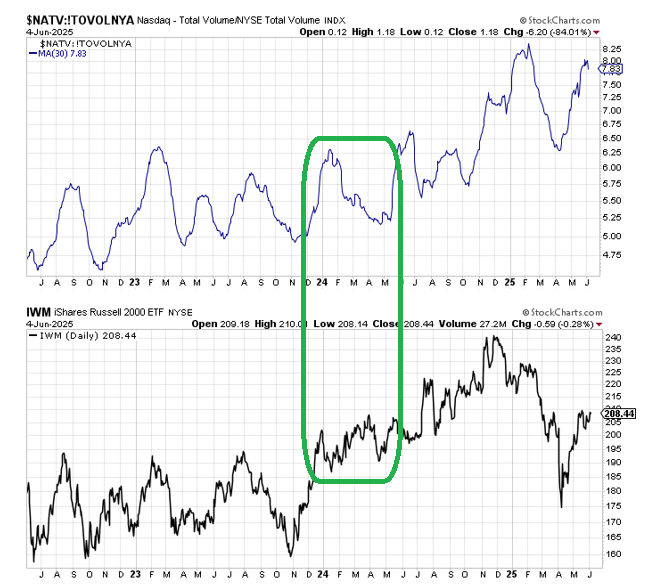
But back to the lighter volume. Nasdaq’s total volume is down 30% since last Thursday. That’s not a minor move. On Monday of this week, we looked at Nasdaq’s volume relative to the NYSE’s volume. I plotted it on a 30-day moving average.
What I do here is I look for peaks, since when this relationship gets extreme, we have often seen the small caps correct or stall out. On this chart, you can see that in early 2024, it was more of a stall-out than it was a correction, although IWM did see a seven percent correction (green box). The other times were not so generous.
When we looked at this chart the other day, it had not yet turned down, but after three days of lighter-than-usual volume, it has done so.
I am still waiting for the 493 (and by extension, IWM) to work off that short-term oversold condition I noted earlier this week. But if the indicators don’t change much by then, I would still expect the market to see more volatility in the coming weeks.