Is the Market Overbought? The Evidence Says Yes.
Let's dive into several important indicators and sectors, telling us that investors are complacent as the market reached overbought levels.
You've reached your free article limit
You've read 0 of 1 free Pro articles.
Friday’s action did very little to change my view that we are overbought and in need of a pullback. I won’t harp on the overbought condition because I laid it out in detail late last week.
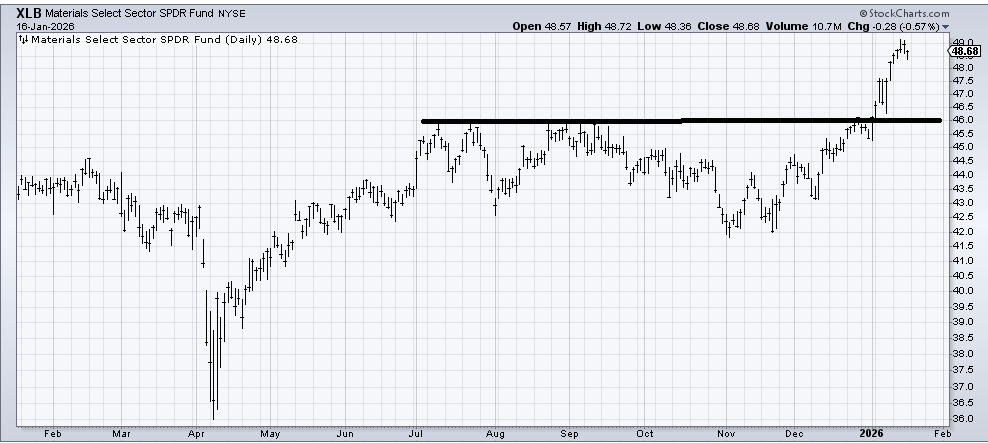
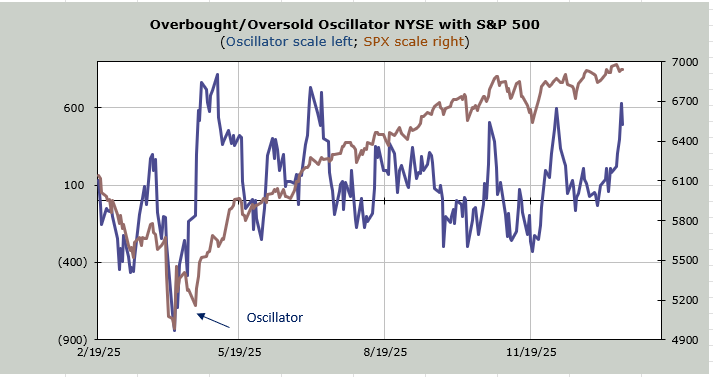
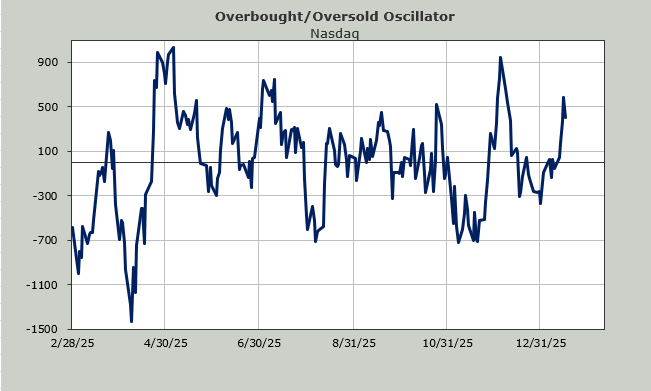
It’s the Russell 2000 Momentum Indicator and my own Overbought/Oversold Oscillator that I am using to determine the overbought condition. And so many charts have run so far that they are in need of a pullback. For example, XLB, which I warmed up to right near the November lows and noted last week there was a short-term target around 50, has started pulling back.
Or even the drugs are in the process of pulling back.
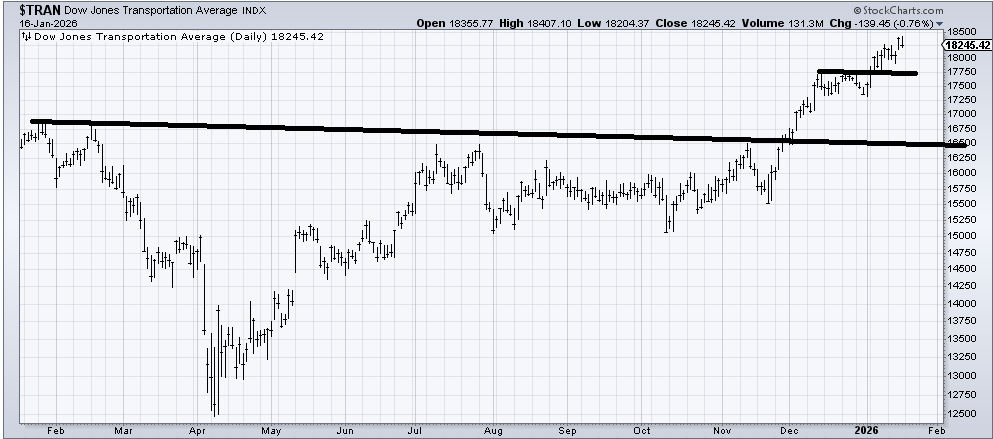
Or the Transports, which I have liked since September, are looking tired up here.
Sure, it’s hard to say the big-cap tech stocks are overbought. It’s hard to say the S&P is overbought because it hasn’t done very much since October. But the 493 are overbought.
On the sentiment front, I do not think folks are giddy. I do think we pushed into very or extremely complacent territory, though. We had giddy in late October when the Investors Intelligence bull-to-bear ratio topped 4.0, when the Daily Sentiment Indicator (DSI) got to the upper 80s for the S&P and Nasdaq, and when the ten-day moving average of the put/call ratio got super low. It’s hard to get giddy when the favored group (tech) isn’t enjoying the ride.
Friday’s put/call ratio was 0.73. It doesn’t get that low often, especially on a flat day. That shows folks are a bit too bullish in the near term. The put/call ratio is not as low as it was heading into early December, when it was 0.70, but it’s the same neighborhood and a similar sentiment to me. Also in early December, we were coming off a low, which we are clearly not doing now.
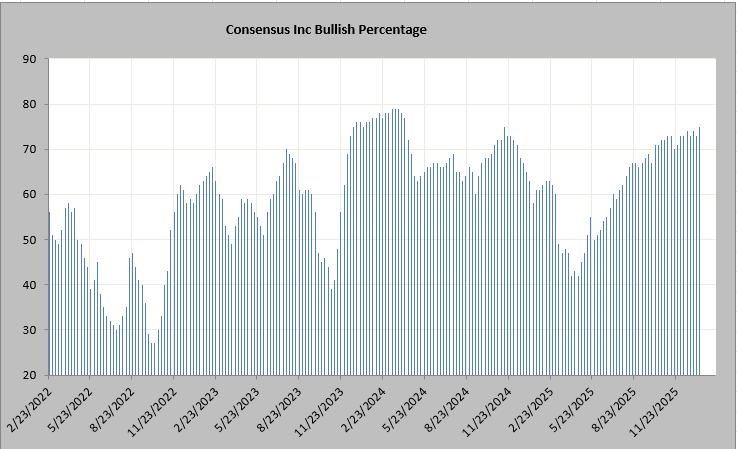
Then there is the Consensus Inc Bullish Percentage. I do not write about this often because it doesn’t move very much, but this week it pushed to 75% which is the highest reading since November 2024. As a reminder, most of the 493 peaked in early December 2024.
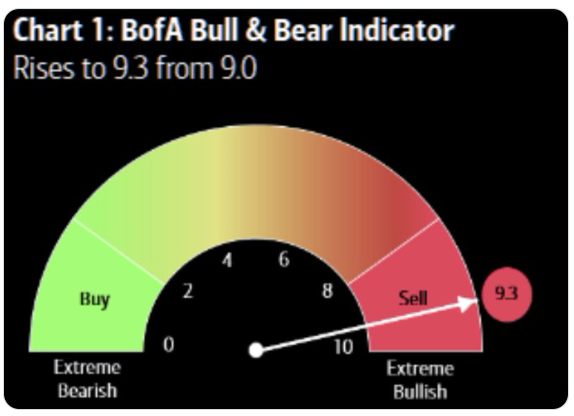
But the indicator I want to highlight is one I have never discussed: the Bank of America Bull/Bear Indicator. It’s flashing ‘sell’ at 9.3. I am not familiar enough with this indicator to say whether 9.3 is giddy or if 9.6 is giddy. I am, however, steeped enough in sentiment to point out that Bank of America is happy to show this indicator to you when it says ‘buy’ and push it constantly, telling their customers to buy. But up here, they are, well, sort of silent on the subject of selling. And ignoring your indicators is a high level of complacency in my book.