Is It Up, Up, and Away, or Will We Need This Indicator to Give Us Another Signal?
Folks went from gloomy to happy in a short time, probably because the market will be higher one year from now, which is typical.
You've reached your free article limit
You've read 0 of 1 free Pro articles.
Was it just a few short days ago that folks were gloomy and depressed, and we were told cash was the best position to have in your portfolio? Why, yes, it was.
And here we are, three trading days later, and the chatter is all about the Zweig Breadth Thrust. Let me begin by telling you that I am the farthest thing from an expert on this indicator. In fact, I’m probably less knowledgeable than most of you when it comes to this indicator. Yet somehow, everyone seems to know that it has worked 100% of the time.
What exactly has it done 100% of the time? Well, the market has been higher one year later. Now, most of you will already know that the market is higher one year later 75% of the time, so all this is really doing is confirming what you already know, right?
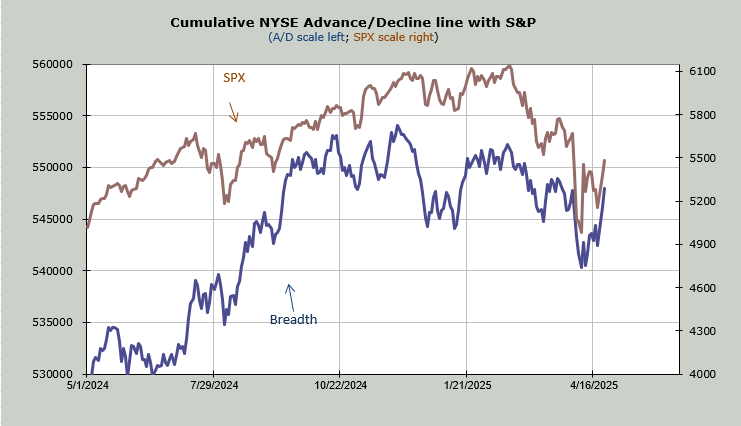
And do we know breadth has been good? We do. How many times have I shown this chart of breadth over the past week or so? Several. The blue line is breadth, and, as I noted, it has been making a higher high (than April 9th) for nearly a week now. I even find it quite amusing that on the day everyone is so excited about breadth was not even the best day breadth had this week.
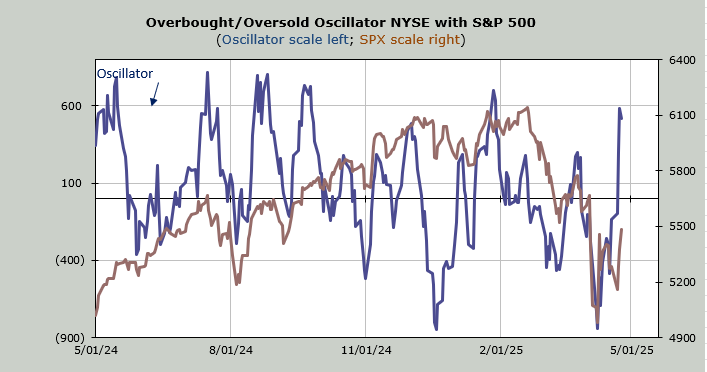
We know breadth has been good because that’s why the Overbought/Oversold Oscillator shot up from the bottom of the page to the top of the page.
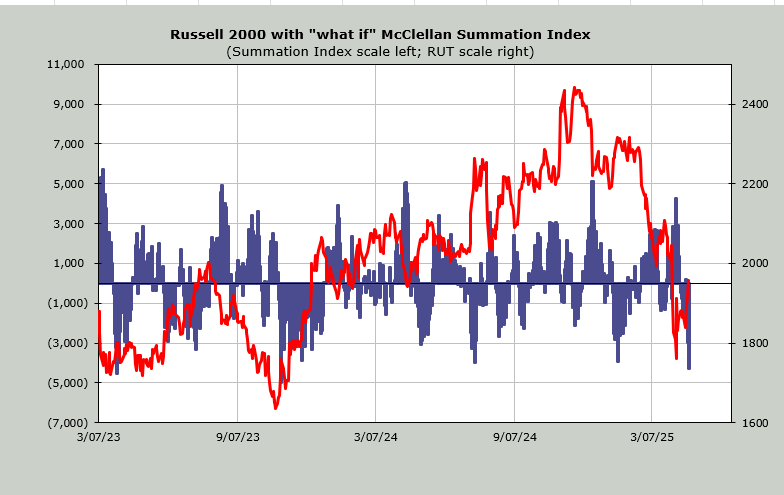
We know breadth has been good because the McClellan Summation Index turned upward last week. In fact, it now requires a net differential of -4300 advancers minus decliners on the NYSE to halt the rise. That doesn’t happen often. It’s also what makes the market short-term overbought. Every single time it has gotten down here, the Russell has pulled back, sometimes just a bit, sometimes a lot more than a bit. I expect a bit, not a lot. I have used the word chop.
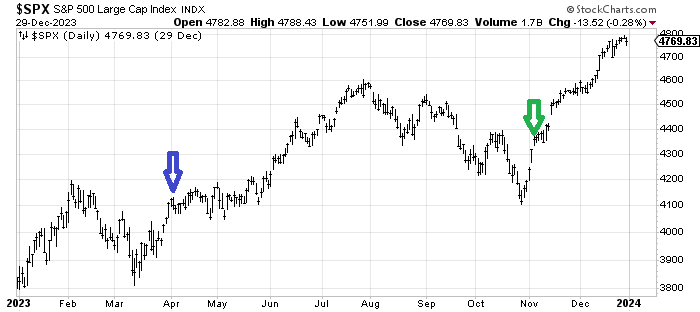
So let’s take a look at the last two Breadth Thrusts. My first observation is I’d bet most think this means up, up, and away, yet if that’s the case, why did we have not one, but two in the year 2023? Yes, that’s right. We got one in the spring, and the market corrected eleven percent over several months that summer/fall.
The blue arrow shows the first Thrust in the spring. We then went sideways for nearly two months. How many of the folks who are so excited now do you think would sit through two months of chop and still be all bulled up? Not many is my guess.
In the fall, we had another one (green arrow), and we spent the week thereafter in a chop. Most folks hope we are at green. I am not smart enough to pick which one would resemble this market, but I do know we are going to be short-term overbought by the end of Friday’s trading, and I said I expect a pullback or chop next week before this, and I see no reason to change that view.