Is Group Rotation Causing the Indicators to Behave Oddly?
Let's compare two versions of several indicators to see what's going on.
You've reached your free article limit
You've read 0 of 1 free Pro articles.
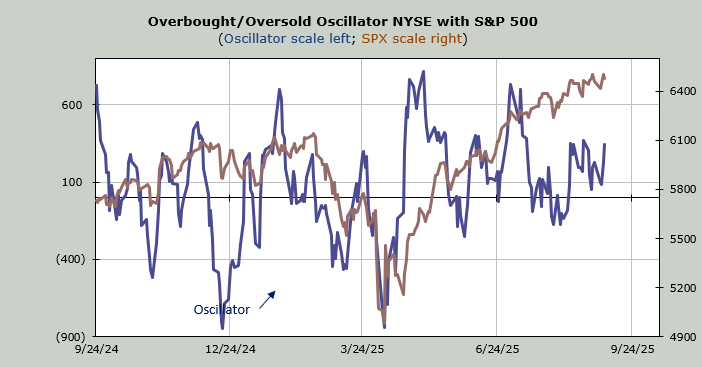
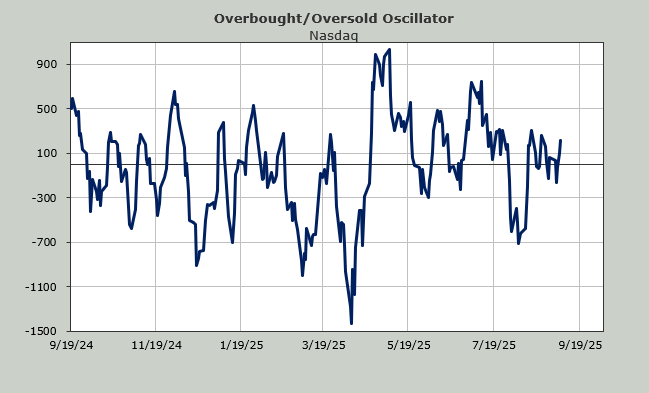
This market is filled with so many oddities, I thought I would take some time today to review some of them. It is my belief that the constant group rotation is what is causing so many of these indicators to diverge from each other or simply go flat to nowhere for the last month or so.
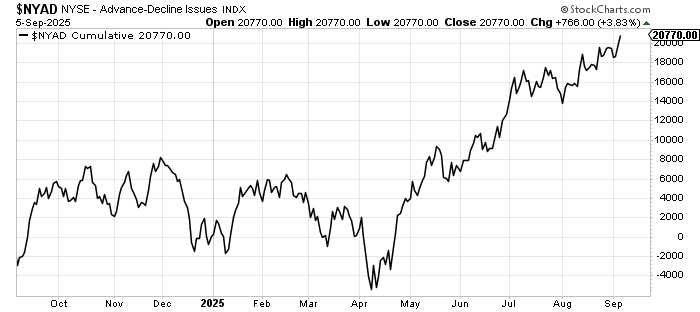
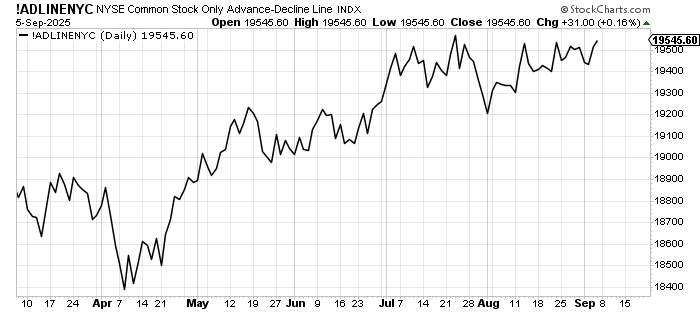
For example, someone pointed out to me that total NYSE breadth is making new all-time highs while the common stocks only breadth is not, although it is fractions away from doing so.
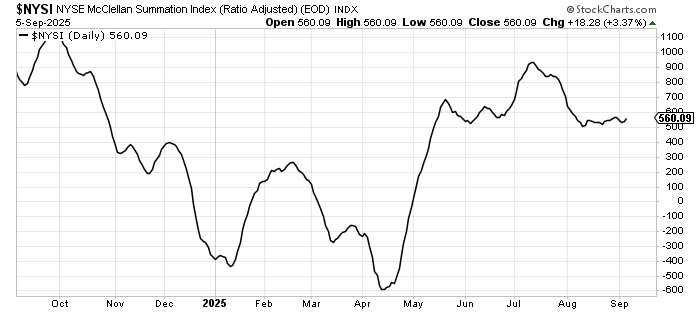
Yet when we apply the more smoothed-out, and therefore trend-finding, McClellan Summation Index indicator to both of these breadth readings, the total is flat as a pancake for the last four to six weeks. You can see how uncommon that is (pun intended).
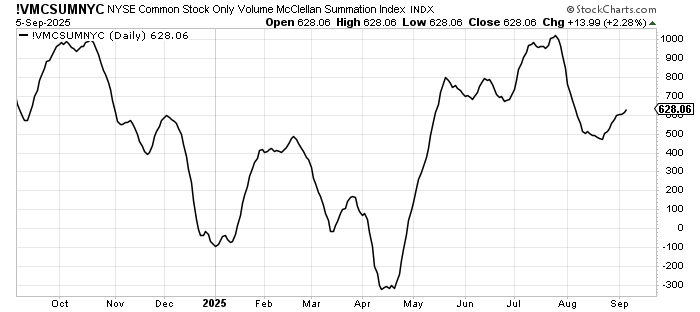
If we use the McClellan Summation Index for common stocks only, where I would remind you the raw totals (chart above) have not yet made a higher high, we see an uptrend in the Summation Index.
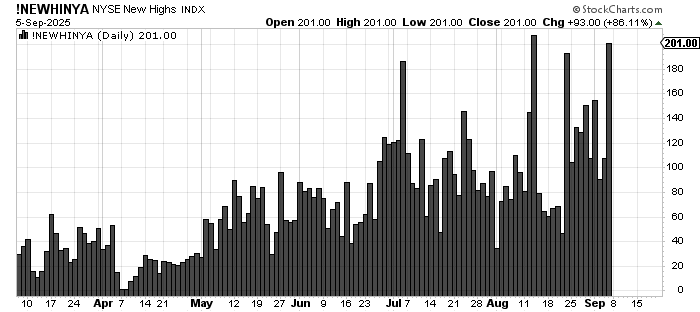
Now let’s look at stocks making new highs. When we use all issues traded on the NYSE, which includes more than just common stocks (think ETFs, Preferreds, etc) we can see that while there is improvement, the number remains below the mid-August peak for now.
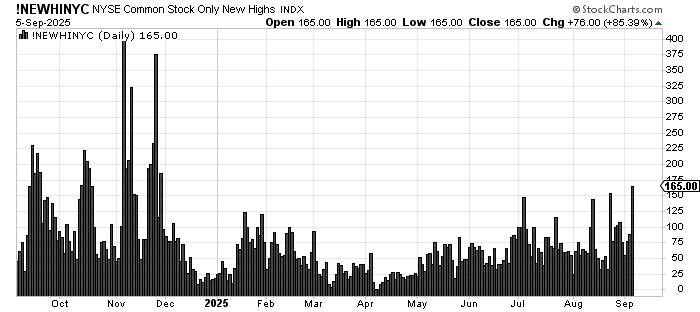
When we use common stocks only, we see it has crept up and over the mid-August peak, yet I remind you that the cumulative breadth using common stocks only has not done so.
Notice how the highs are still below the peak readings from late 2024. The same is true for the total highs.
Typically, when bonds are strong and interest rates are falling, the number of new highs and breadth on the NYSE increase because there are so many bond funds and bond-related issues. So don’t you find it curious that when we ex out all those bond-related issues, common stocks only are doing better? I do.
And let’s not forget that while rates are falling, so are the Utes. Why are Utes down five percent while rates are falling?
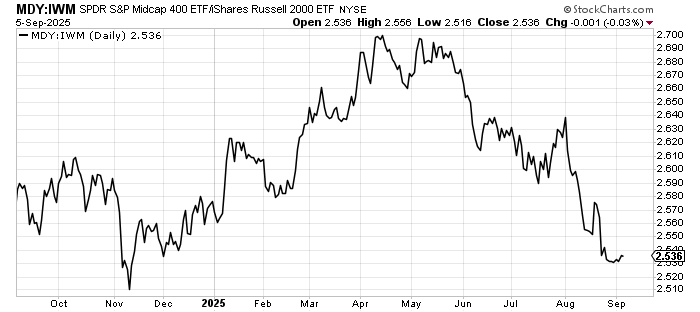
Now, I know someone will say that’s because small caps are doing better. But you know what else is odd? Look at how Midcaps (MDY) have done relative to Small Caps (IWM). That is a downtrend since April! And that trend has accelerated since the calendar turned to August.
Sentiment, as I have noted, is not giddy, but more complacent. We see the Investors’ Intelligence with just over three times the bulls to bears, while the American Association of Individual Investors (AAII) continually shows more bears than bulls. We saw NAAIM’s exposure kissing 100 a few weeks ago, and now it is down to 81.
I’ve even seen the put/call ratio for the VIX soar to 1.28 last Thursday and swoon to .20 on Friday. So if you don’t like what you’re seeing—or even if you like what you’re seeing—just wait a few days and it will probably change again!