Iran Talk Shocker! Bearish Chart Signals, Big Shoptalk Event
Let's look at the market's beatdown, chart some ugliness and check the latest in the Iran conflict as president signals positive talks with Tehran.
You've reached your free article limit
You've read 0 of 1 free Pro articles.
 Market_Recon_TSP1_KL
Monday morning. Last full week of March. The "Ugly Stick" has been out and about. Stocks have been under pressure in earnest for about a month, but actually peaked two months ago. For a bit, those with huge exposure to debt security markets experienced relief as their bonds "saved" their portfolios. I, fortunately, had been one of those folks.
Lately, however, that refuge has withered and blown away in the wind. What's working now? Not even gold or silver. Not Bitcoin. Not even natural gas, despite the war in the Middle East. Only oil. Nothing else is working regularly or broadly for net-long investors. Oh, and cash. Those with significant cash positions have not only witnessed the preservation of their own capital, but have seen the U.S. dollar rise in value in relative terms vs. the value of planet Earth's other reserve currencies. Party.
U.S. equity index futures have stumbled into negative territory as Sunday night has melted into Monday morning. Asian markets had a very rough session on Monday. South Korea's KOSPI closed down 6.48% as the Shanghai Composite gave up 3.63% and Japan's Nikkei 225 surrendered 3.59%. As I work this morning, on this note, European markets are opening in the hole as well.
The pressure accelerated into the weekend in New York last week. The S&P 500 gave up 1.51% on Friday after giving up 0.27% on Thursday and 1.36% on Wednesday. The broadest large-cap index in the U.S. has now closed the red for nine of the past 12 sessions, is now down 4.95% for 2026 and closed on Friday 7.1% below its recent high. The Nasdaq Composite closed down 2.01% on Friday, is down 6.86% year to date and closed on Friday 9.9% below its late 2025 high. Both the S&P 500 and Nasdaq 2000 surrendered their respective 200-day simple moving averages on Friday.
That brings us to the small-cap Russell 2000. The nation's best-known measure of small cap equity performance, closed down 2.26% on Friday, is down "just" 1.75% for 2026, but is 10.9% below its January high. That's correction territory, as ridiculous as that seems in the algorithmic high-speed trading era. Traders and investors have long referred to drops of 10% or more but less than 20% from recent highs as "corrections" and drops of 20% or more as "bear markets."
Of course, these terms were created during different times, back when humans were in control of trade, trade was slower and moves of 1% to 2% for any single security in one day were somewhat rare. These levels are still used by the financial media as a form of sensationalism, but we really should either come up with new levels or new terms. Many stock prices move 10% or more in a single session depending on news flow now that price discovery has been reduced from a centralized auction to a game based more on momentum and falsely created inefficiency. For the moment though, my "whine and cheese" is meaningless. U.S. financial markets are in a bad spot.
(Note: Please see news of talks between Iran and the U.S. at the bottom and how that could affect oil prices, as Pres. Trump announces "very good and productive" talks.)
The Past Week
There were a number of both external and internal pressures placed upon asset prices in U.S. markets last week. Of course, the war and the closure of the Strait of Hormuz remain front and center. Brent Crude popped for a gain of almost 9% last week, going out close to $112 per barrel. I see Brent trading above $114 per barrel this morning, as the Iranian military continued to play offense against its neighbors as Pres. Trump's deadline to reopen that passage to commerce approached.
WTI Crude ran nearly flat last week, going out on Friday around $98 per barrel. But the sweet stuff was trading close to $100 per barrel through the zero-dark hours on Monday morning. This is the driving force behind renewed fears that consumer prices will reignite, and inflation expectations will take on a form of contagion that will spread across the economy. February PPI (producer / wholesale level inflation) printed at much hotter levels than had been anticipated last Wednesday morning.
That forced the Federal Reserve's Federal Open Market Committee not only to hold rates where they were on Wednesday afternoon, but to show a heightened concern over the direction of inflation for the near to medium-term future in their communications. Treasury markets reacted to this new fear as well. The U.S. Ten-Year Note paid as much as 4.39% on Friday after yielding just 4.17% on Wednesday. I see U.S. Ten-Year paper yielding more than 4.42% this morning. Not good.
Related: What's Your Bias? Do You Follow the 200-Day or 6500 Support Level?
Week Ahead
It appears as the opening bell approaches on Monday morning that investors will continue with their focus on the ability of energy commodities to pass through the Strait of Hormuz and flow toward the rest of the planet, to Asia in particular. This is causing broader concern over the ability to and expense of creating alternative supply lines that might be out of the line of fire.
Fed funds futures markets are also pricing in a new trajectory for short-term interest rates. This is painful for markets as 2026 rate cuts are being completely priced out of valuations for both equity and debt securities. This will be a very light week for domestic macroeconomic data and a nearly non-existent week for corporate earnings.
That means that the focus will remain on the Middle East and on last week's Fed meeting. There are a few items, however, that investors and traders will have to keep their eyes and ears open for. Fourth quarter data for productivity and unit labor costs will be revised on Tuesday. On Friday, the University of Michigan will update its March surveys for consumer sentiment and inflation expectations. This will truly matter as the survey done earlier this month was largely conducted ahead of the expansion of the U.S./Israeli war with Iran.
Lastly, on the corporate front, the Shoptalk Spring Conference will take place this Tuesday through Thursday at the Mandalay Bay in Las Vegas. More than 10,000 attendees and 180 speakers are expected. The focus will be on the transformation of the AI-focused economy. Headline speeches are expected to be made by Bret Taylor, who is the current Chairman of OpenAI, Hillary Super of Victoria's Secret (VSCO) , Steve Huffman of Reddit (RDDT) , Niraj Shah of Wayfair (W) , and Nicola Mendelsohn of Meta Platforms (META)
Strange Brew
I think this is the first time since I was 13 years old that I have come into a Monday morning (or any morning) with no self-managed equity market exposure. Those who do not know why I am temporarily 100% in cash can refer to Friday's "note to readers" section. Still waiting on my platform and the bank to play ball together, so I am still handcuffed. From the looks of things, being forced to go "all cash" and getting most of that work of getting out of those positions done on early Thursday has been a gift admittedly not of my own making.
The Week That Was...
U.S. financial markets had yet another tough five-session period, last week. The S&P 500 has now posted four consecutive red-candle weeks and six losing weeks in seven. The Nasdaq Composite has also posted four-straight losing weeks and nine losing weeks in 10. Yikes. Think small-caps have done better? Think again. The Russell 2000, too, has posted four straight red-candle weeks and has posted seven losing weeks in nine. Last week...
- The S&P 500 gave up 1.51% on Friday and 1.9% for the week.
- The Nasdaq Composite lost 2.01% on Friday, and 2.07% for the week.
- The Nasdaq 100 gave back 1.88% on Friday and 1.98% for the week.
- The Russell 2000 surrendered 2.26% on Friday and 1.68% for the week.
- The S&P Small Cap 600 lost 2% on Friday and 1.29% for the week.
- The S&P Midcap 400 gave up 2.24% on Friday and 1.34% for the week.
- The Dow Transports lost 0.54% on Friday but gained 0.66% for the week.
- The Philly Semis gave up 2.45% on Friday but added 0.31% for the week.
- The KBW Bank Index gained 0.44% on Friday and 1.63% for the week.
On Friday, 10 of the 11 S&P sector SPDR exchange-traded funds closed out the session in the red, led lower by the utilities (XLU) and the REITs (XLRE) as defensive type offerings offered no safe haven. The Financials (XLF) were the lone winner as Treasury yields spiked.
For the week, nine of the eleven S&P sector SPDR ETFs traded lower, with the utilities, materials (XLB) and Staples (XLP) all losing more than 4%. All Nine funds that lost ground for the week, lost at least 1% for the five-day period. Energy (XLE) obviously led the winners on rising oil prices.
The Chart
Readers will note that the S&P 500 closed below its 200-day simple moving average on Thursday and instead of quickly regaining that level on Friday, fell further, failing to make contact with that important red line. In theory, this unleashed the hounds as professional managers reduce long-side equity exposure. The only possible saving grace here might be that Friday was a "triple-witching" expirations event and wound up as the highest trading volume expirations event of all-time. Hence, price discovery may have been skewed to that event and not the result of supply and demand based on either fundamentals or technical inputs.
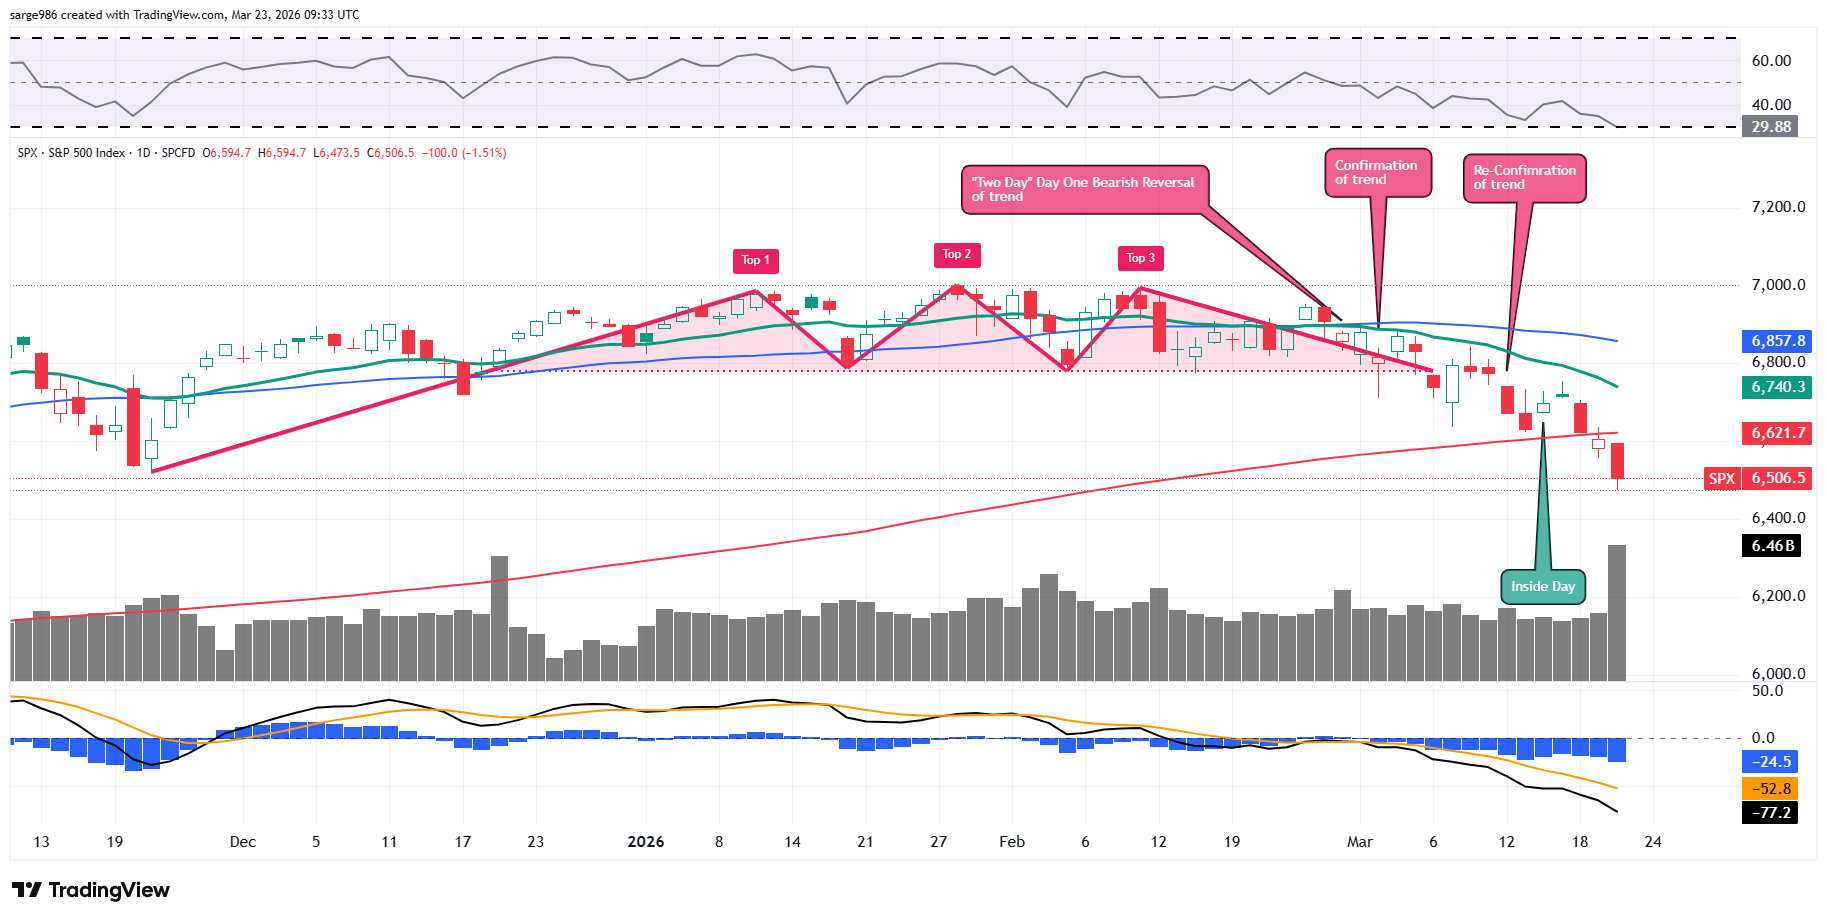
As for the indicators, Relative Strength is running precisely at levels that could be considered to be technically oversold. Despite what you may have heard, this is a first for 2026. In fact, this is the first time that the S&P 500 is technically oversold since last April. That's 11 months. The daily moving average convergence divergence is in simply awful condition. The histogram of the 9-day EMA stands well below zero, as do the 12-day EMA and 26-day EMA. To add insult to injury, that 12-day line is running well below the 26-day line. These are all overtly bearish signals.
Miss You (Remembering the Bull Market)
I've been holding out so long
I've been sleeping all alone
Lord, I miss you
I've been hanging on the phone
I've been sleeping all alone
I want to kiss you - Jagger, Richards (The Rolling Stones), 1978
Earnings
Incredibly, as the market struggles, and the economy shows some signs of weakness, analysts are seeing an improving outlook for corporate profitability ahead. As of March 19, according to FactSet, for the first quarter, Wall Street sees year-over-year earnings growth for the S&P 500 of 12.5%, up from 11.6% last week. Wall Street also sees revenue growth of 9.6%, up from 9.4% a week ago. For the full year of 2026, the street looks for earnings growth of 16.3%, up from 14.7% two weeks ago, on revenue growth of 8.3%, up from 7.7% also two weeks back. The outlook for the second quarter is also improving rapidly.
At the moment, the technology sector is projected to have grown earnings a stunning 44.8% for the first quarter with the materials in second place at growth of 24.4%. Three sectors, health care, energy and communication services are projected to have suffered a first-quarter earnings contraction. Yes, even with market prices for energy commodities on the rise.
As we are currently in between seasons, the earnings calendar is extremely light this week. There are few noteworthy firms reporting. Among those names that are expected to post quarterly results this week will be Chewy (CHWY) , Cintas (CTAS) , Paychex (PAYX) and Commercial Metals (CMC) .
Valuation
Still using data provided by FactSet, the S&P 500 ended last week trading at 20.3-times 12 months' forward-looking earnings, down from 21.6-times two weeks prior. This is well above the five-year average of 20.0-times for the index as well as well above its 10-year average of 18.9-times.
The S&P 500 also ended last week trading at 24.8-times trailing 12 months' earnings, down from 27.8-times two weeks back. That also stands well above the five-year (24.8-times) and ten-year (23.2- times) averages for the index.
Just six of the 11 sectors are now trading above their five-year average valuations, led by the industrials (24.6 times) and the staples (22 times). Health care is now trading in line with its five-year average, while the discretionaries, tech, the REITs and the financials are all now undervalued relative to their five-year norms.
Fed Funds Futures
Fed Funds futures trading in Chicago are currently pricing in a 0% probability for a quarter-percentage point rate cut at the next FOMC policy meeting on April 29 and a 12% likelihood for a quarter-percentage point rate hike. There are now no rate cuts priced in for calendar year 2026. In fact, no cuts or hikes are priced into these markets until very late 2027 and everything will change several times over by then, so why even go there?
Hold Everything!
As we were about to go to press with this piece, I saw that Pres. Trump announced on social media that the U.S. and Iran have had over the past two days, "VERY GOOD AND PRODUCTIVE CONVERSATIONS REGARDING A COMPLETE AND TOTAL RESOLUTION OF OUR HOSTILITIES IN THE MIDDLE EAST. BASED ON THE TENOR AND TONE OF THESE IN DEPTH, DETAILED, AND CONSTRUCTIVE CONVERSATIONS, WHICH WILL CONTINUE THROUGHOUT THE WEEK, I HAVE INSTRUCTED THE DEPARTMENT OF WAR TO POSTPONE ANY AND ALL MILITARY STRIKES AGAINST IRANIAN POWER PLANTS AND ENERGY INFRASTRUCTURE FOR A FIVE DAY PERIOD, SUBJECT TO THE SUCCESS OF THE ONGOING MEETINGS AND DISCUSSIONS."
Obviously, this took prices for risk assets higher, and prices for crude oil lower.
Economics
(All Times Eastern)
08:30 - Construction Spending (Jan): Expecting 0.1% m/m, Last 0.3% m/m.
The Fed
(All Times Eastern)
No public appearances scheduled.
Today's Earnings Highlights (Consensus EPS Expectations)
No significant quarterly earnings scheduled.
At the time of publication, Guilfoyle had no position in any security mentioned.
