Investors Consider Reducing Risk as Semiconductors Reach Overbought
Let's look at an important measure of investors' risk appetite that could provide the clues for what's next.
You've reached your free article limit
You've read 0 of 1 free Pro articles.
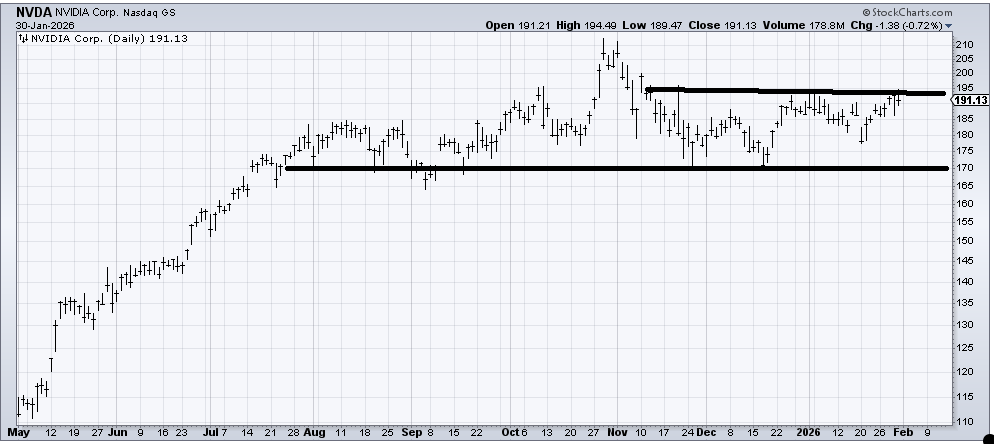
A few months ago, when NVIDIA (NVDA) plunged down to 170 in mid-December, I said I thought the semis (SOX) were oversold. At the time, the SOX plunged to 6750. Since that time, NVDA has done okay (+12%), but the SOX has rallied nearly 20%. Each time I have been asked about the semis since then, I have not wavered: they were not yet overbought.
That changed late last week. The metric I use to measure an oversold or overbought condition (too complex to explain it, which is unusual for me!) reached an overbought condition on Thursday.
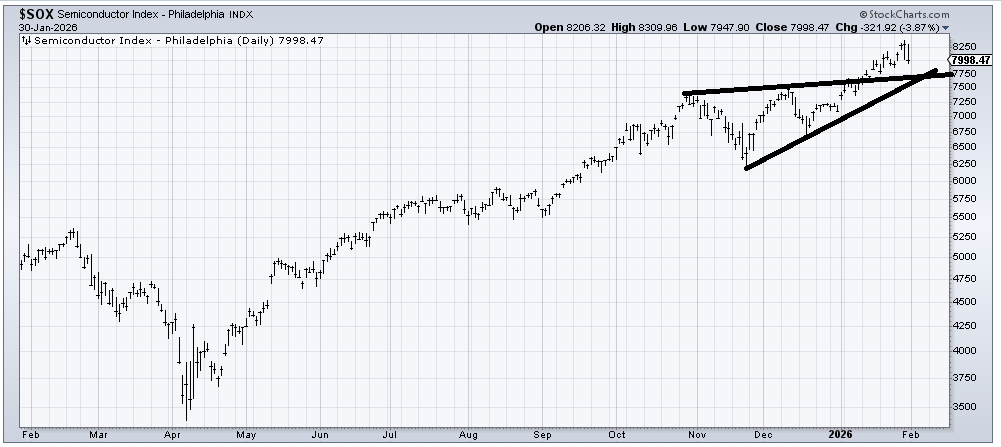
As we have come to know in this market, oversold conditions tend to work better than overbought ones, and even when the overbought conditions work, they tend to take a while to prove out. I would not say I am bearish on the semis—they would have to show some breaking down for that—but I suspect they are more apt to underperform or lose upside momentum in the month of February.
With that in mind, let’s take another look at the ratio of the S&P to Nasdaq. I showed you this chart on the first trading day of the new year and have repeatedly updated you that nothing had changed. It still hasn’t. However, once again, the ratio is knocking on the resistance level that I think is important because this is our fourth trip up to it.
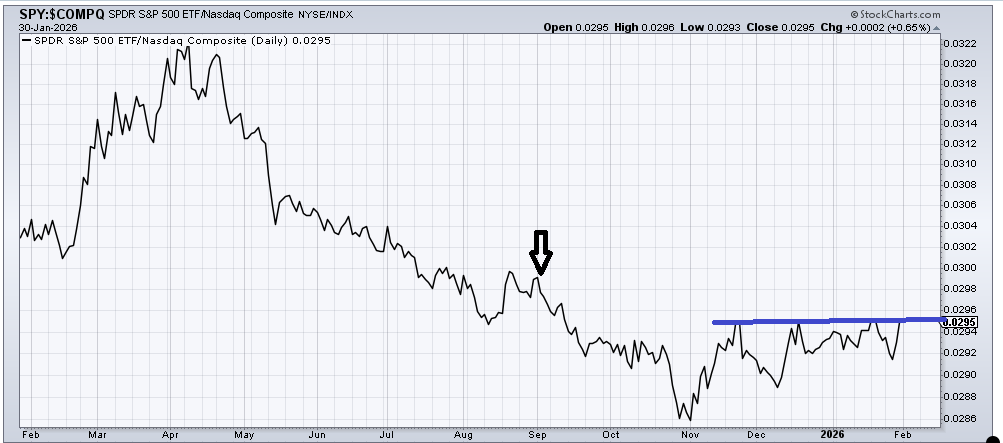
Notice that the trend for this ratio has been down since the April lows. It threatened to make a higher high in September (arrow), but it failed to do so. It is once again threatening. If it breaks through—and remember I want to be able to see the break from the other side of the room, and I use thick lines—that ought to be intermediate-term bearish.
What this ratio tells us is folks’ willingness to go out on the risk scale. When they are feeling risky, they gravitate toward high beta stocks (think Nasdaq); when they are feeling less risky, they gravitate toward the more staid stocks of the S&P. That’s why I think we need to watch this ratio, especially as the semis are getting overbought.
Away from that, not much changed during Friday’s session. Maybe folks got a bit more bearish. Heck, my weekly Twitter Poll (asking the next 100-point move for the S&P) had the most votes for down since early August. But the new lows did not expand beyond Thursday. The Bank Index, the first group to stumble out of the gate in 2026, has not broken down and has held that line I have highlighted. And the 493 continue to correct.
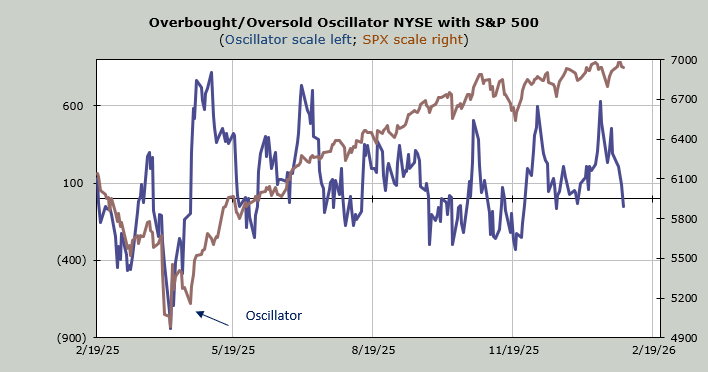
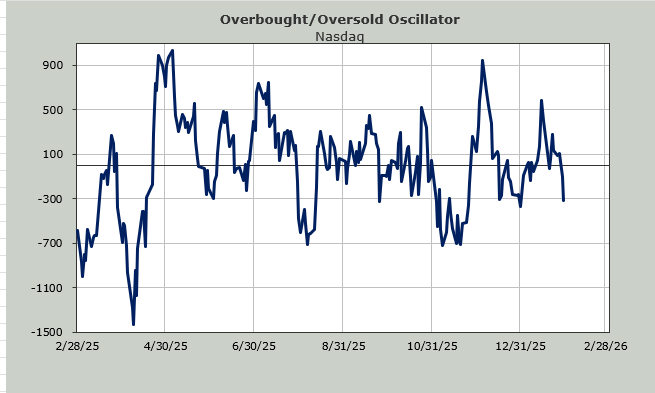
Then there is the Overbought/Oversold Oscillator. I know it looks oversold. The math says a day or two on the upside, and then there is more work to be done to get to a proper oversold condition.