In a News-Driven Market, It's Critical to Pay Attention to the Indicators
During times like these, when it's so hard to know what's going on, the indicators provide an important roadmap.
You've reached your free article limit
You've read 0 of 1 free Pro articles.
News-driven markets. No one likes them. They make you crazy. Recall I explained a few weeks ago that back in the summer and fall of 1990, after Iraq invaded Kuwait, we were in a news-driven market with rockets flying this way and that, and the markets reacting to every headline.
That period of time taught me a lot about the news. If I ignore it and focus on my indicators, I will tend not to get jerked around. It doesn’t mean there won’t be jerking around, but if we are only reactionary to the news, we will surely get jerked around. At least I can try and mitigate it.
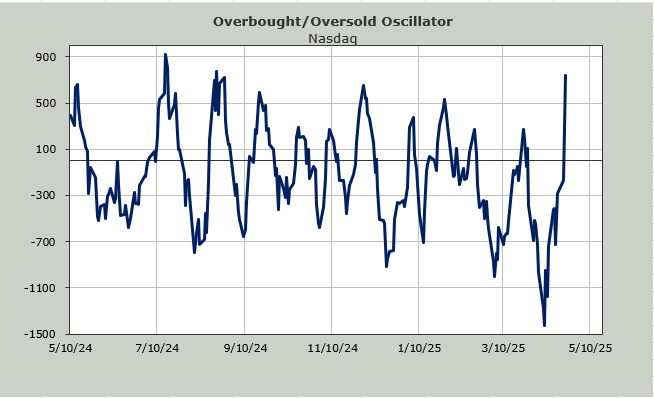
Which brings me to the Overbought/Oversold Oscillator. I think I confused many yesterday when, instead of showing you the table of numbers, I wrote them out. First, a short tutorial.
When we drop a string of big red numbers, we view that as oversold or not yet overbought. It means the window is open for a rally. When we drop a string of big black/green numbers, I view it as overbought/difficult to rally.
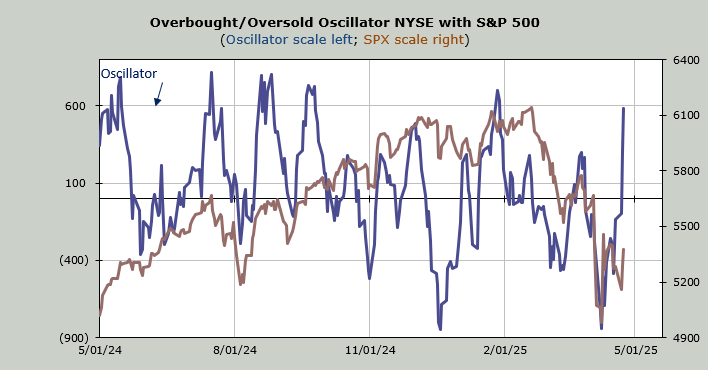
What we are looking at is the net of the breadth on the NYSE (advancers minus decliners). As we headed into this week, we were set to drop all those big red numbers from just after Liberation Day. I noted that I thought we should see the Oscillator get up and over the zero line. And it has. In a big way. It is almost back to where it was in late January.
Now we should take a look at the numbers we are dropping going forward. What you see is that there is still one more big red number to drop (on Friday of this week), but after that, there is a decent amount of positive ones to drop next week. That is why I think the market is just about overbought in the short term.
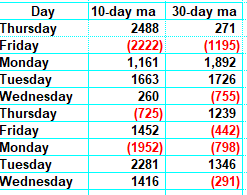
Notice that I have also included the 30-day moving average numbers so you can see they aren’t terribly supportive of a rally next week either. I would like to see a pullback on Thursday and another push up Friday, just to get us past that Friday number, but when I look at this setup, I conclude next week should be more choppy, if not see some giveback of this week’s rally.
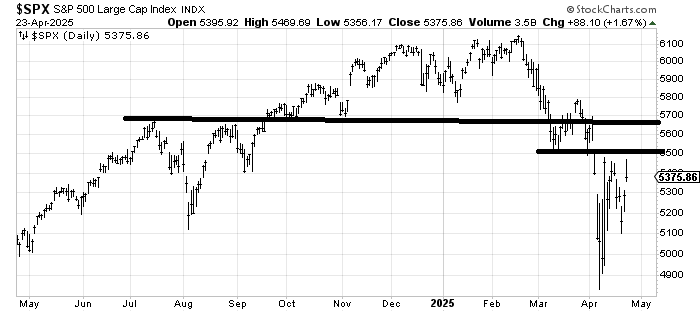
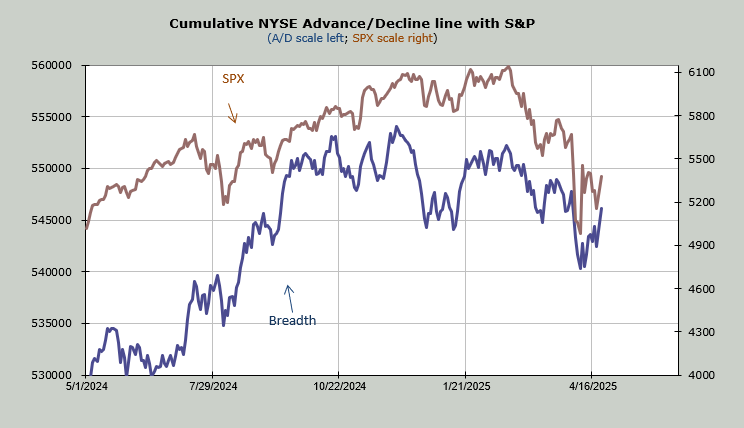
Many of the indicators are still positive. Heck, look at breadth as it made another higher high Wednesday (over the April 9th high) while the S&P couldn’t do it.
But there is resistance overhead, and resistance needs to be eaten through. That typically means ups and downs as sellers show up happy to get even, and buyers who were there a few weeks ago show up again. That choppy action is quite typical after the type of decline we’ve seen. I’ve described it as the ‘Should I or shouldn’t I’ period. That’s why it continues to be a trading market.