Imagine All the Panic, Leading to a Tradable Low
Let's look at Justin Mamis' Sentiment Cycle to see where we are and what it will take to get the market to bottom.
You've reached your free article limit
You've read 0 of 1 free Pro articles.
Some of you might think I talk about getting some panic in the market too much. I wouldn’t argue against that because I do. I think it is an important aspect of not only market psychology but market mechanics.
As I have noted before, I think panic cleans things out, gets rid of the hopeful. When there is no hope left to ‘get back to even,’ it’s no different than when someone goes for a clean slate in their lives.
Friday came close to some panic, but not quite. I prefer a day where 90% of the volume is on the downside. Friday got there for a minute during the day but ended at 87%. Maybe I am asking for perfection where there is none, but let’s go back to the chart of the Sentiment Cycle created by my mentor, Justin Mamis. This time, let’s take a look at it with the chart of the QQQs.
About a month ago, we looked at this chart, and my contention was we were just to the right of the words ‘buy the dip’, that little rally attempt midway through the decline. I have drawn in the words on the QQQ chart with the caveat that it is rarely exact but almost always a version of it.
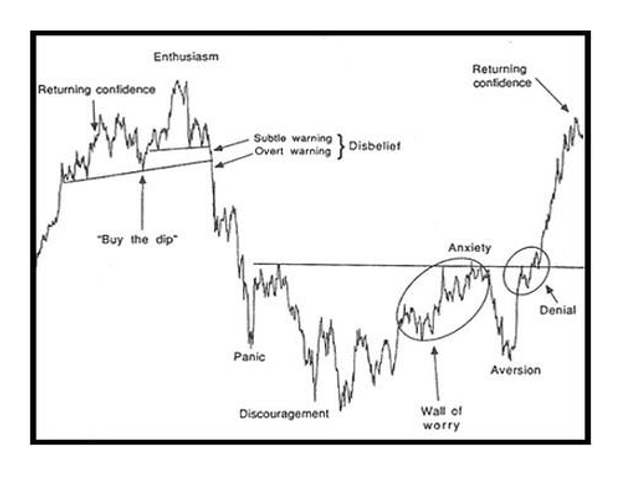
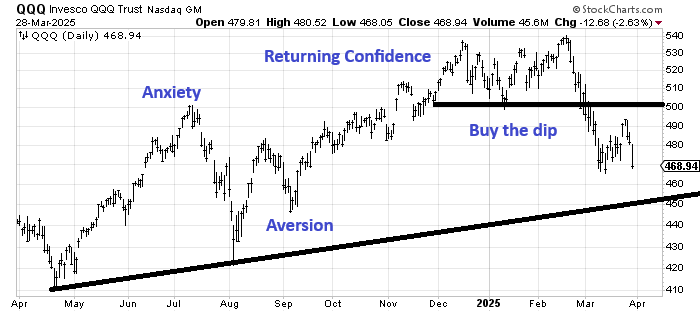
So, when you look at these two charts, you can see what comes next: Panic. It need not be exact, but Panic tends to lead to better rallies, tradeable ones. Ones that last longer than a few days.
So, imagine if we can get some of that sort of action early this week. Imagine the put/call ratio clocking in well over 1.0. Imagine 90% of the volume on the downside. Imagine the VIX getting jumpy.
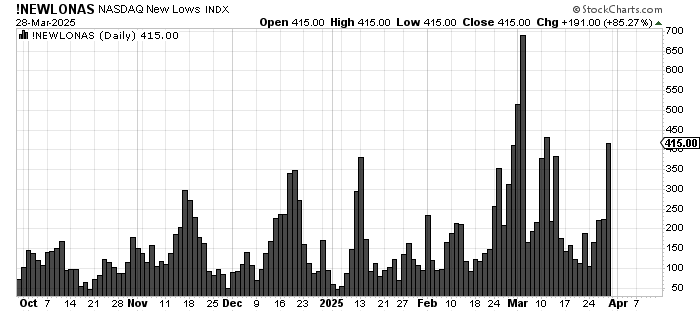
Imagine that despite all of that, there are still fewer than 688 stocks making new lows on Nasdaq (not a requirement, but helpful).
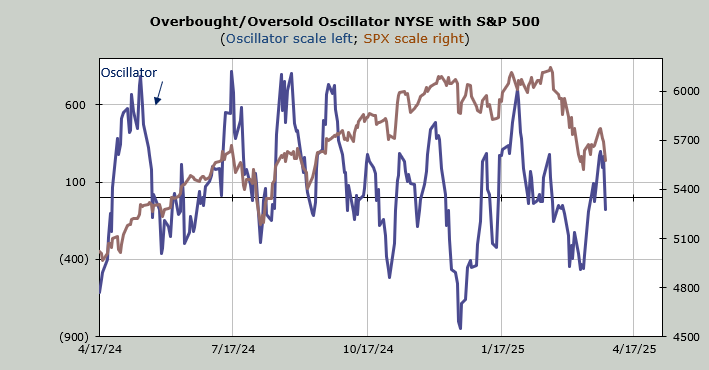
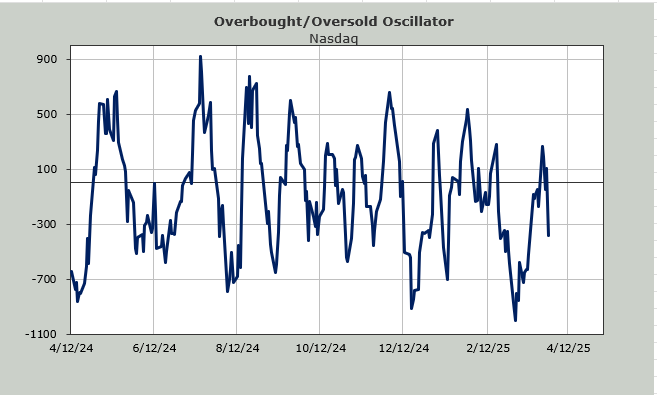
Imagine my Overbought/Oversold Oscillator getting back to an oversold condition. The math shown here on Friday ‘says’ a few days of downside would get us there.
Imagine the NAAIM Exposure Index goes from the current 54 to, oh, say, 30-something. Not extreme but definitely the lowest in more than a year.
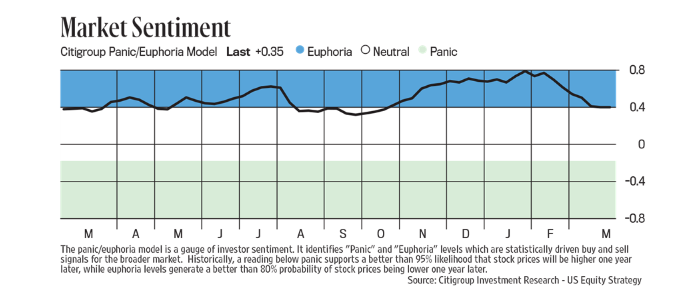
Imagine the Citi Panic/Euphoria Model finally slips out of the blue (Euphoria) and into the white. Again, not extreme, but a change worth noting.
Imagine everyone talking about Death Crosses. We have discussed this before regarding the Russell and the SOX, but the S&P’s well-watched 50 and 200-day moving average lines are 150 points apart, so they are tumbling closer to each other.
Imagine the Daily Sentiment Index (DSI), which is now 23 for Nasdaq, becomes a teenager or even a tween (I think single digits would be hard to achieve so quickly because that last mile is very difficult to get to).
That would be a nice setup for another trading rally. And that chart of the Sentiment Cycle above would agree. Getting there, though, is never enjoyable.
