If You're Looking for Fear, You Won't Find It Here
The market may have dropped on Thursday, but fear remains low.
You've reached your free article limit
You've read 0 of 1 free Pro articles.
You know that old expression about being careful what you wish for because you may get more than you asked for? Well, I wanted the market to pull back after a Wednesday rally, and it has, but it doesn’t seem to have generated much fear.
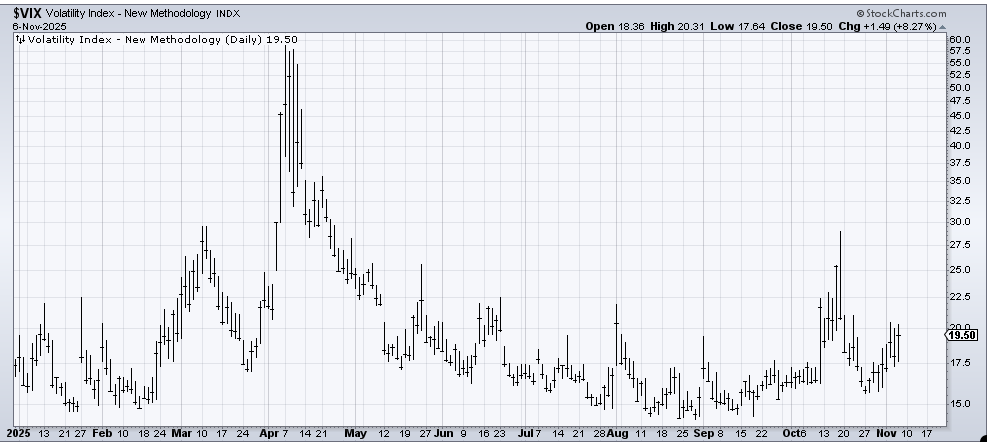
For example, the VIX hasn’t gotten jumpy. The put/call ratio couldn’t even get anywhere near 1.0 on Thursday.
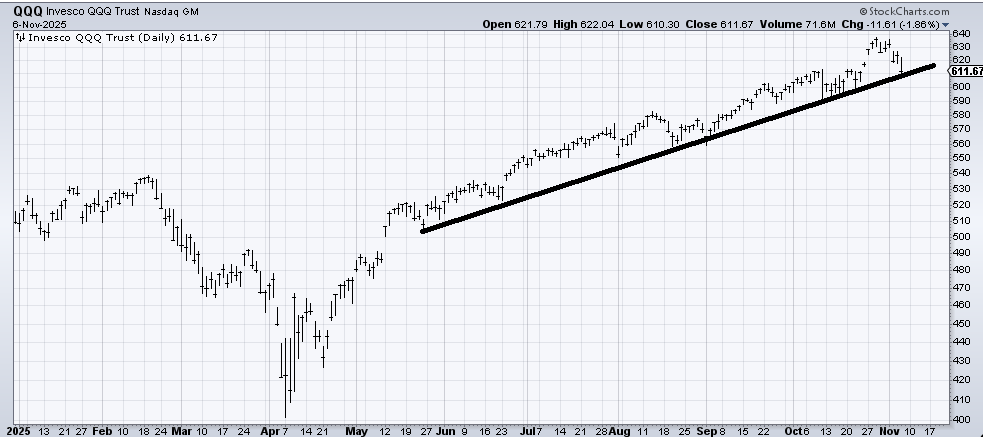
Part of me thinks, well, maybe because instead of buying protection, they are just selling their winners, but heck, Micron was solidly green on Thursday, so was Western Digital. Then I look at the chart of the QQQs. Look at how solid this line has been since May. Every single time it has threatened to break, it has bounced. So, if I had to wonder what would get folks a little scared, I would say breaking this line would do it.
Another sign that there wasn’t much selling on Thursday was that a mere 59% of the volume was on the downside on the NYSE. Ahh, I know you’re thinking, but Nasdaq is where the selling was. Well, Nasdaq had 61% of the volume on the downside. Again, the selling was pretty concentrated, the same way the buying has been.
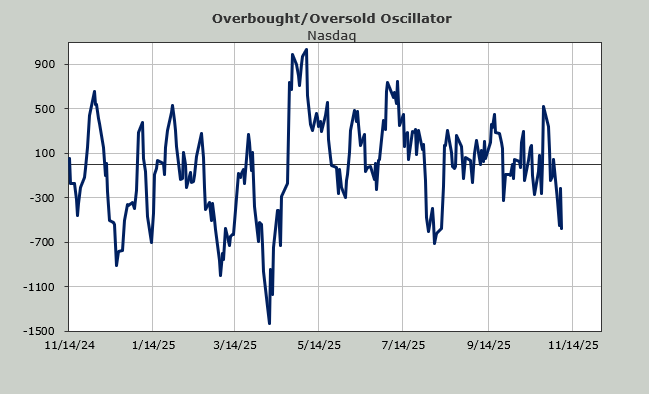
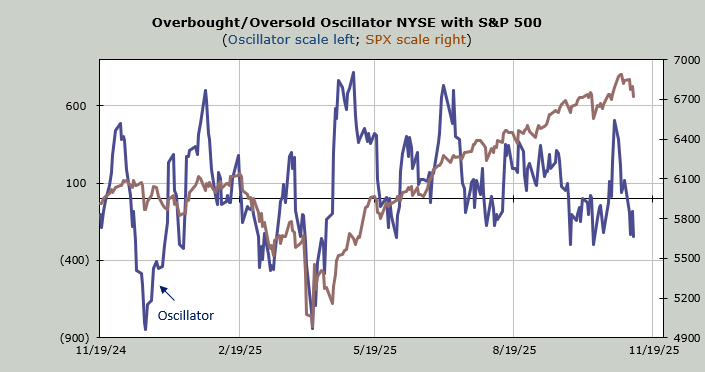
But aren’t we set up to get to a short-term oversold condition next week? We are. The math hasn’t changed on the Overbought/Oversold Oscillator (reviewed here two days ago). And you can see the chart hasn’t changed much either, as we’re still sloshing around down here.
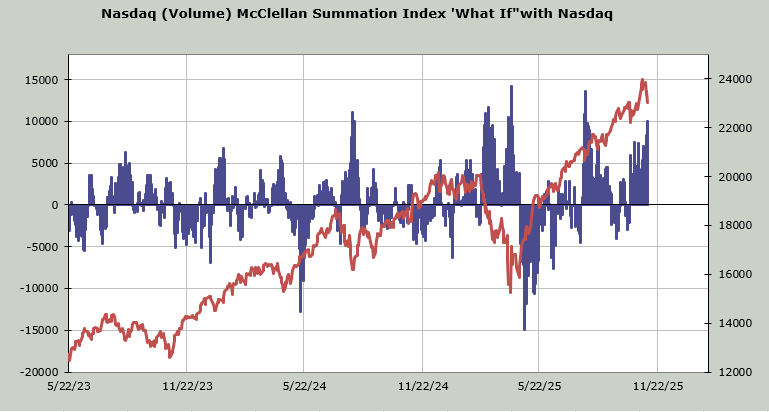
So let’s look at some other measures. We’ve discussed the Nasdaq McClellan Summation Index and its downward movement, but it has been so weak that it now needs about ten billion shares (that’s up minus down volume) to halt the decline. You can see that if we get it to where it needs about 12 to 14 billion shares, we’re oversold. One caveat: it reached that level in early March, and we rallied for a few days before heading south again.
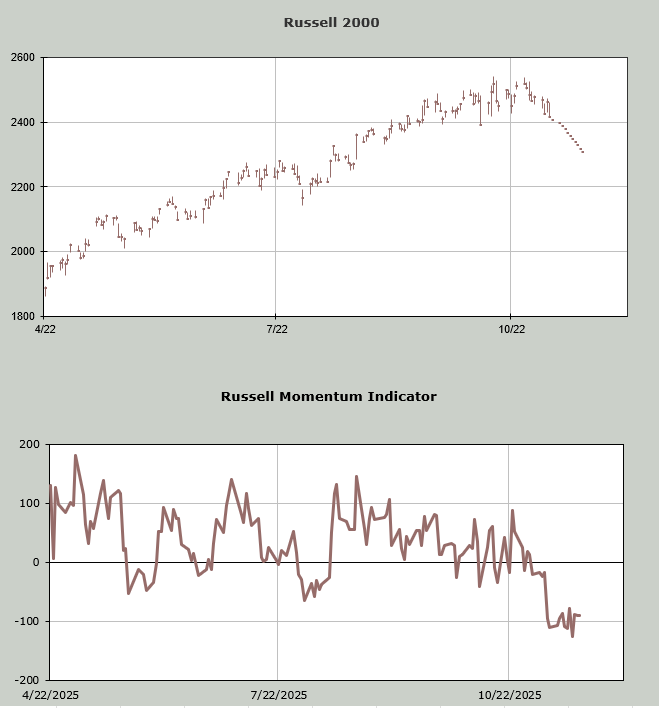
Then there is the Russell Momentum Indicator. It’s been a long time since we have looked at this. As a reminder, what I do is I walk the price down (in this case, about one hundred points over the next week or so) to see the point in time that the indicator stops going down. It stops going down midweek next week. The best scenario is if it goes UP, even if price goes down. Right now, it just stops going down.
Let’s see what transpires over the next few days to see if we get that set up. I’d like to start seeing a bit more concern/fear about the market.