If You Want to Be a Good Investor, Listen to the Indicators and Not Your Emotions
The market is short-term overbought. Here are some indicators proving it.
You've reached your free article limit
You've read 0 of 1 free Pro articles.

Last week, there was someone who took issue with my view that the short-term overbought reading ought to lead to some chop/small pullback and then rally again. It has been my theme for three weeks now, but somehow last week it struck a nerve.
I pay attention to the indicators. I pay attention to sentiment. I pay attention to charts. There are times when my interpretation of the indicators, sentiment, and charts can be wrong, but mostly what I try not to do is be emotional about the market or the news. Yes, I know it’s difficult to do since wars tend to get folks emotional, and certainly big market moves tend to get folks emotional. I don’t always succeed, but I try.
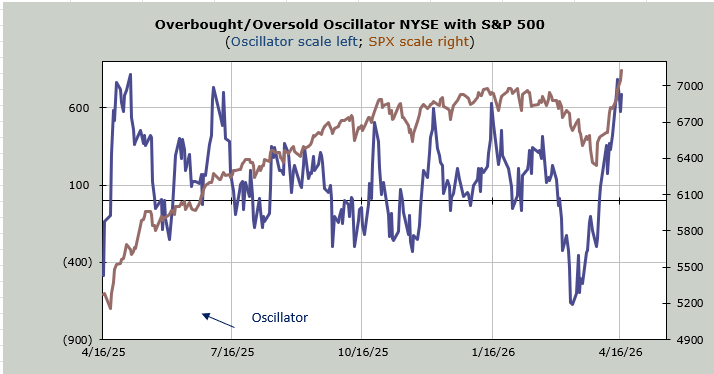
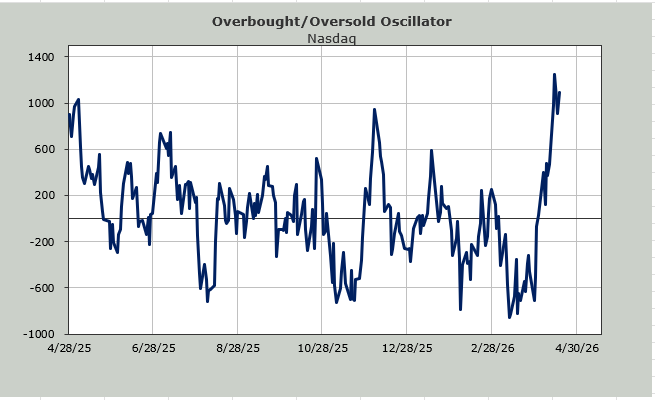
Yes, I do think we’ve gone too far too fast, thus the overbought chop and/or pullback notes. Notice that the Overbought/Oversold Oscillator has, in fact, been chopping about for a few days now. And while the indexes have not given anything back, as discussed here Friday plenty of groups sat it out last week.
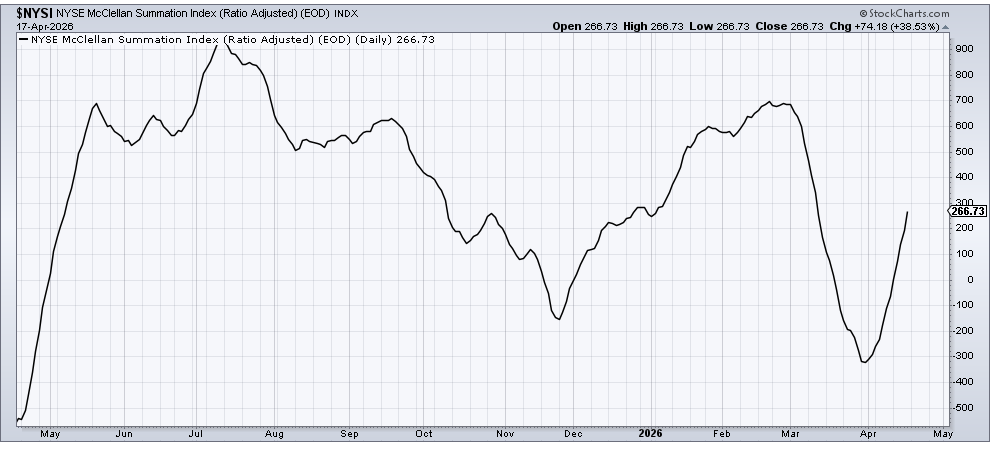
But on an intermediate-term basis, the McClellan Summation Index is still rising. It will need a net differential of -3500 advancers minus decliners on the NYSE to halt the rise. That makes it short-term overbought, but more importantly, it is not (yet) in danger of rolling over. If it rolls over, then I will surely let you know—and my view on the market would change.
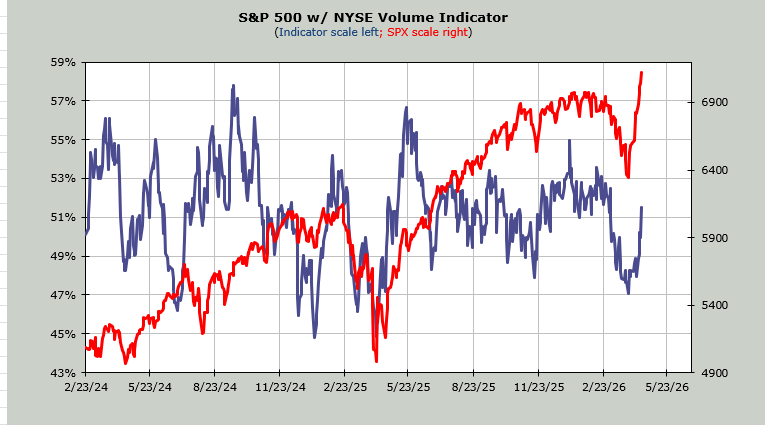
The Volume Indicator got to 47% (oversold) on March 31st and is now at 51%, which is not overbought. A reading in the mid to upper 50s is overbought. So again, when we get that sort of reading, that will be a change.
What has changed is sentiment—and it has done so with gusto. It is knocking on the door of extreme. That door could open this coming week.
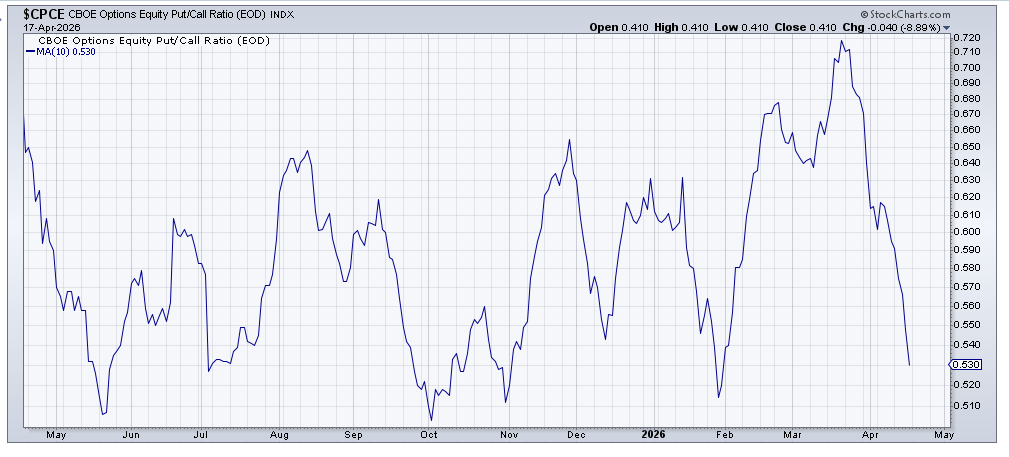
The equity put/call ratio has been under .50 for three straight days. That means the ten-day moving average of this metric has plummeted from nearly .72 to .53. Once it gets to the low 50s, we’re into extreme. I even read where Friday saw the most calls traded—ever. That’s extreme. By the end of this coming week, I expect this indicator to make a low.
Then there is the Daily Sentiment Indicator (DSI). Three weeks ago, Nasdaq’s reading got to 12, which was extreme, although I wished it had gotten to single digits, but we take what the market gives us, not what we want.
Now that indicator stands at 82. It is once again knocking on the door of extreme. Since this runs on a scale of zero to one hundred, readings over 80 are what I would term knocking on the door, and over 85 yellow flashing lights. Over 90 and it’s gone into the red zone.
There are plenty of issues with the current rally, like the fact that the number of stocks making new highs is lagging or that breadth and volume haven’t been stellar. But those things tend to matter when the intermediate-term indicators are rolling over, and sentiment is frothy or giddy.
In my view, markets require patience. Getting emotional about it tends not to help. Pullbacks, though, are helpful because they tell us where the buyers are.
