If a U.S. Market Index Looked Like This One We'd All Be Salivating
Folks are finally noticing what's happening with European stocks, but is it too late? However, another overseas chart brings to mind a U.S. market from over 35 years ago and bears watching.
You've reached your free article limit
You've read 0 of 1 free Pro articles.
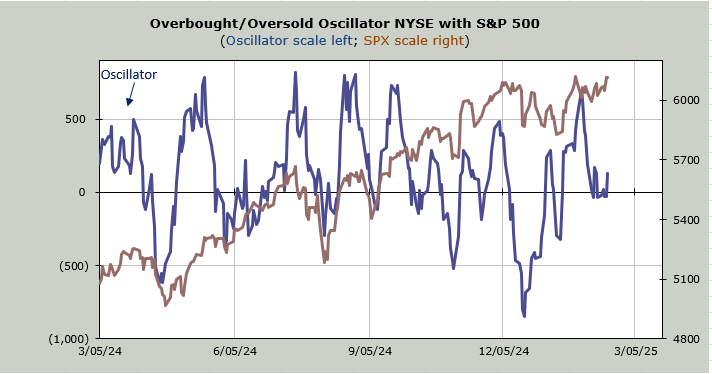
You know what happened in the last week to the indicators? Nothing.
You know what else happened in the market in the last week? Folks finally noticed European stocks. How could they not with the German DAX making new highs and up 10% on the year? But somehow it took until this past week for it to show up on the radar.
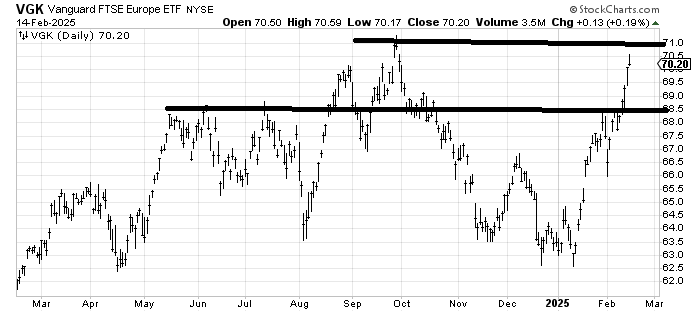
I am a terrible chaser when it comes to charts that are up so much. I much prefer when charts are down and out and the narrative is terrible and the chart refuses to break down. That’s what happened last fall with Vanguard FTSE Europe VGK, an ETF to be long Europe, one I cited to you back then.
The news was awful and it refused to break: French elections, European economies weak, etc. It has now screamed upward to resistance and is in desperate need of a pullback.
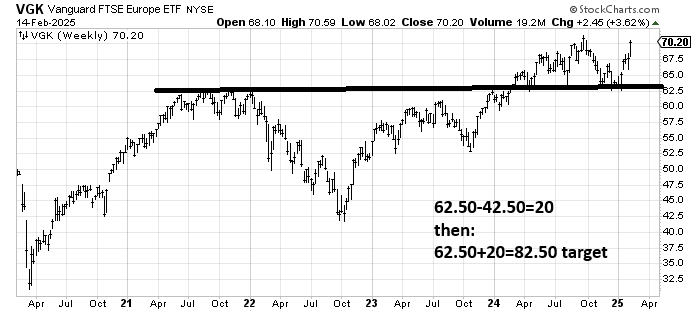
But let’s take a look at the weekly chart of VGK now. Again, you can see the resistance but that pullback in the November/January time frame on this chart was what the folks who write textbooks would look for: a pullback to the breakout. I have done the math for a measured target, which I would expect longer term — over months, and after a pullback — to the $82.50 area.
There is another weekly chart I should highlight because if we had a U.S. market index that looked like this all the chart folks would be salivating. Here’s KraneShares CSI China Internet ETF KWEB. Again, in the near term there is resistance but get up and over this $40-45 area and folks who don’t even look at charts will be citing the chart.
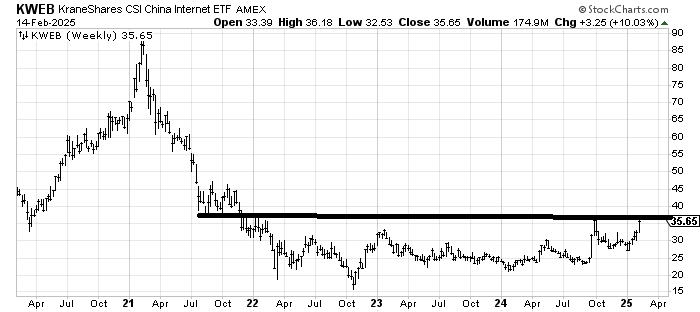
I hate analogy charts for a variety of reasons but let’s go back 35 years and look at the Nasdaq and how many years it went sideways after the 1987 Crash. Four years, some might say five. Now ask yourself: Is there a U.S. market that looks like that now?
This doesn’t mean I expect KWEB to explode and keep on going as the Naz did (again, most analogies die at some point) but that’s a base, just as the Nasdaq was more than a quarter of a century ago.
But what about the U.S. market? Well I asked that we probe over the old highs to see what was there and you know what happened? It was like that meme where the baby runs down the hall, turns the corner and turns right around and runs right back the way they came. But as I noted, I think it gets another chance on Tuesday. After that the momentum turns right back to chop.
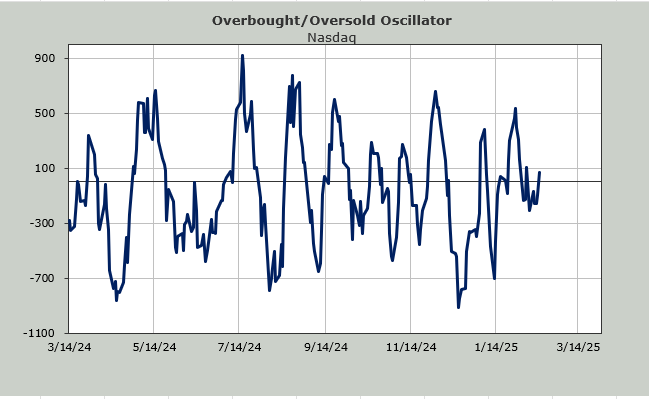
You see the way the Oscillator lifted off the zero line after being stuck there for a week or so? That was Friday. That leaves the window open for Tuesday before the numbers turn back to overbought.
We got to the point midweek last week where six of the prior 10 days had seen breadth negative (thus rendering us a little oversold). After Monday we’re looking at six of the ensuing nine days where the Oscillator drops positive numbers. Using this indicator it’s hard to see us break out and keep running although the contrarian in me hates all that talk of seasonality (market is supposed to be weak in the latter part of February).
But based on the low put/call ratio (0.70) on Friday and all the folks who voted "up" (for the next 100 points in the S&P 500) in my weekend twitter poll (61%), it seems most folks are not betting on the seasonal pattern.
I’m still in the chop camp but would love to see us get over the resistance in the S&P just to see if stocks can confirm the indexes, something they haven’t been able to do in months.