How Low Can the Dow Go? Let's Forecast the Dow’s Downside
Here's how a veteran Wall Street analyst taught me to forecast the Dow Jones Industrial Average. Plus a few little secrets I learned years ago about managing risk.
You've reached your free article limit
You've read 0 of 1 free Pro articles.
I was about to speak to a group of finance professionals at the University of Denver when I had the privilege of chatting with Ralph Acampora, a veteran Wall Street technical analyst. We discussed his forecasting methods, and I asked how he predicted the Dow Jones Industrial Average (DJIA).
He explained his bottom-up approach: analyzing trends, support and resistance, and basic technical indicators for each stock, summing their prices, and dividing by the current divisor — a figure that adjusts stock prices of the underlying companies for many factors such as corporate actions and splits. I thought it was brilliant.
Understanding Your Risk Can Help You Adjust Your Portfolio at Times Like This
With markets feeling uncertain, investors and traders want to understand the risks. Inspired by Ralph, I rolled up my sleeves to assess the downside potential of the Dow over the next quarter.
Using my proprietary method, I evaluated each of the 30 Dow stocks, blending technical downside risk with fundamental factor models. I also adjusted for pairwise correlation between stocks — an effect I explored in Chapter 11 of The Handbook of Risk (John Wiley), titled "Converging Correlations and Market Shocks." During selloffs, stock correlations spike, eroding diversification benefits as most stocks sink together.
Taking the Playbook From Different Market Cycles
There are a few little secrets I learned years ago about managing risk. The first one is — in normal markets, pairwise correlation between Dow stocks averages around 0.30. During mild corrections, it rises to 0.50; in severe crises — like the 2008 Financial Crisis, 2010 Flash Crash, or 2020 Covid-19 selloff — it can hit 0.90. Volatility also surges: a stock with a typical daily volatility of 1.5% might see a 50% increase (to 2.25%) in a moderate correction and a 200% jump (to 4.5%) in a severe one. I factored these dynamics into my forecast, alongside timing, as correction durations vary widely.
The next secret has to do with the length of time a correction lasts. The median DJIA correction (a decline of 10% or more from a recent high) lasts 30-60 trading days (6-12 weeks), though the average stretches to 70-90 days (3-4 months). Some resolve quickly — e.g., the 2020 Covid crash (-37%) took just 27 days — while others, like the 2015-2016 correction, dragged on for 11 months. For this forecast, I conservatively assumed a 63-trading-day horizon (roughly one quarter).
Forecasting the Dow’s Downside
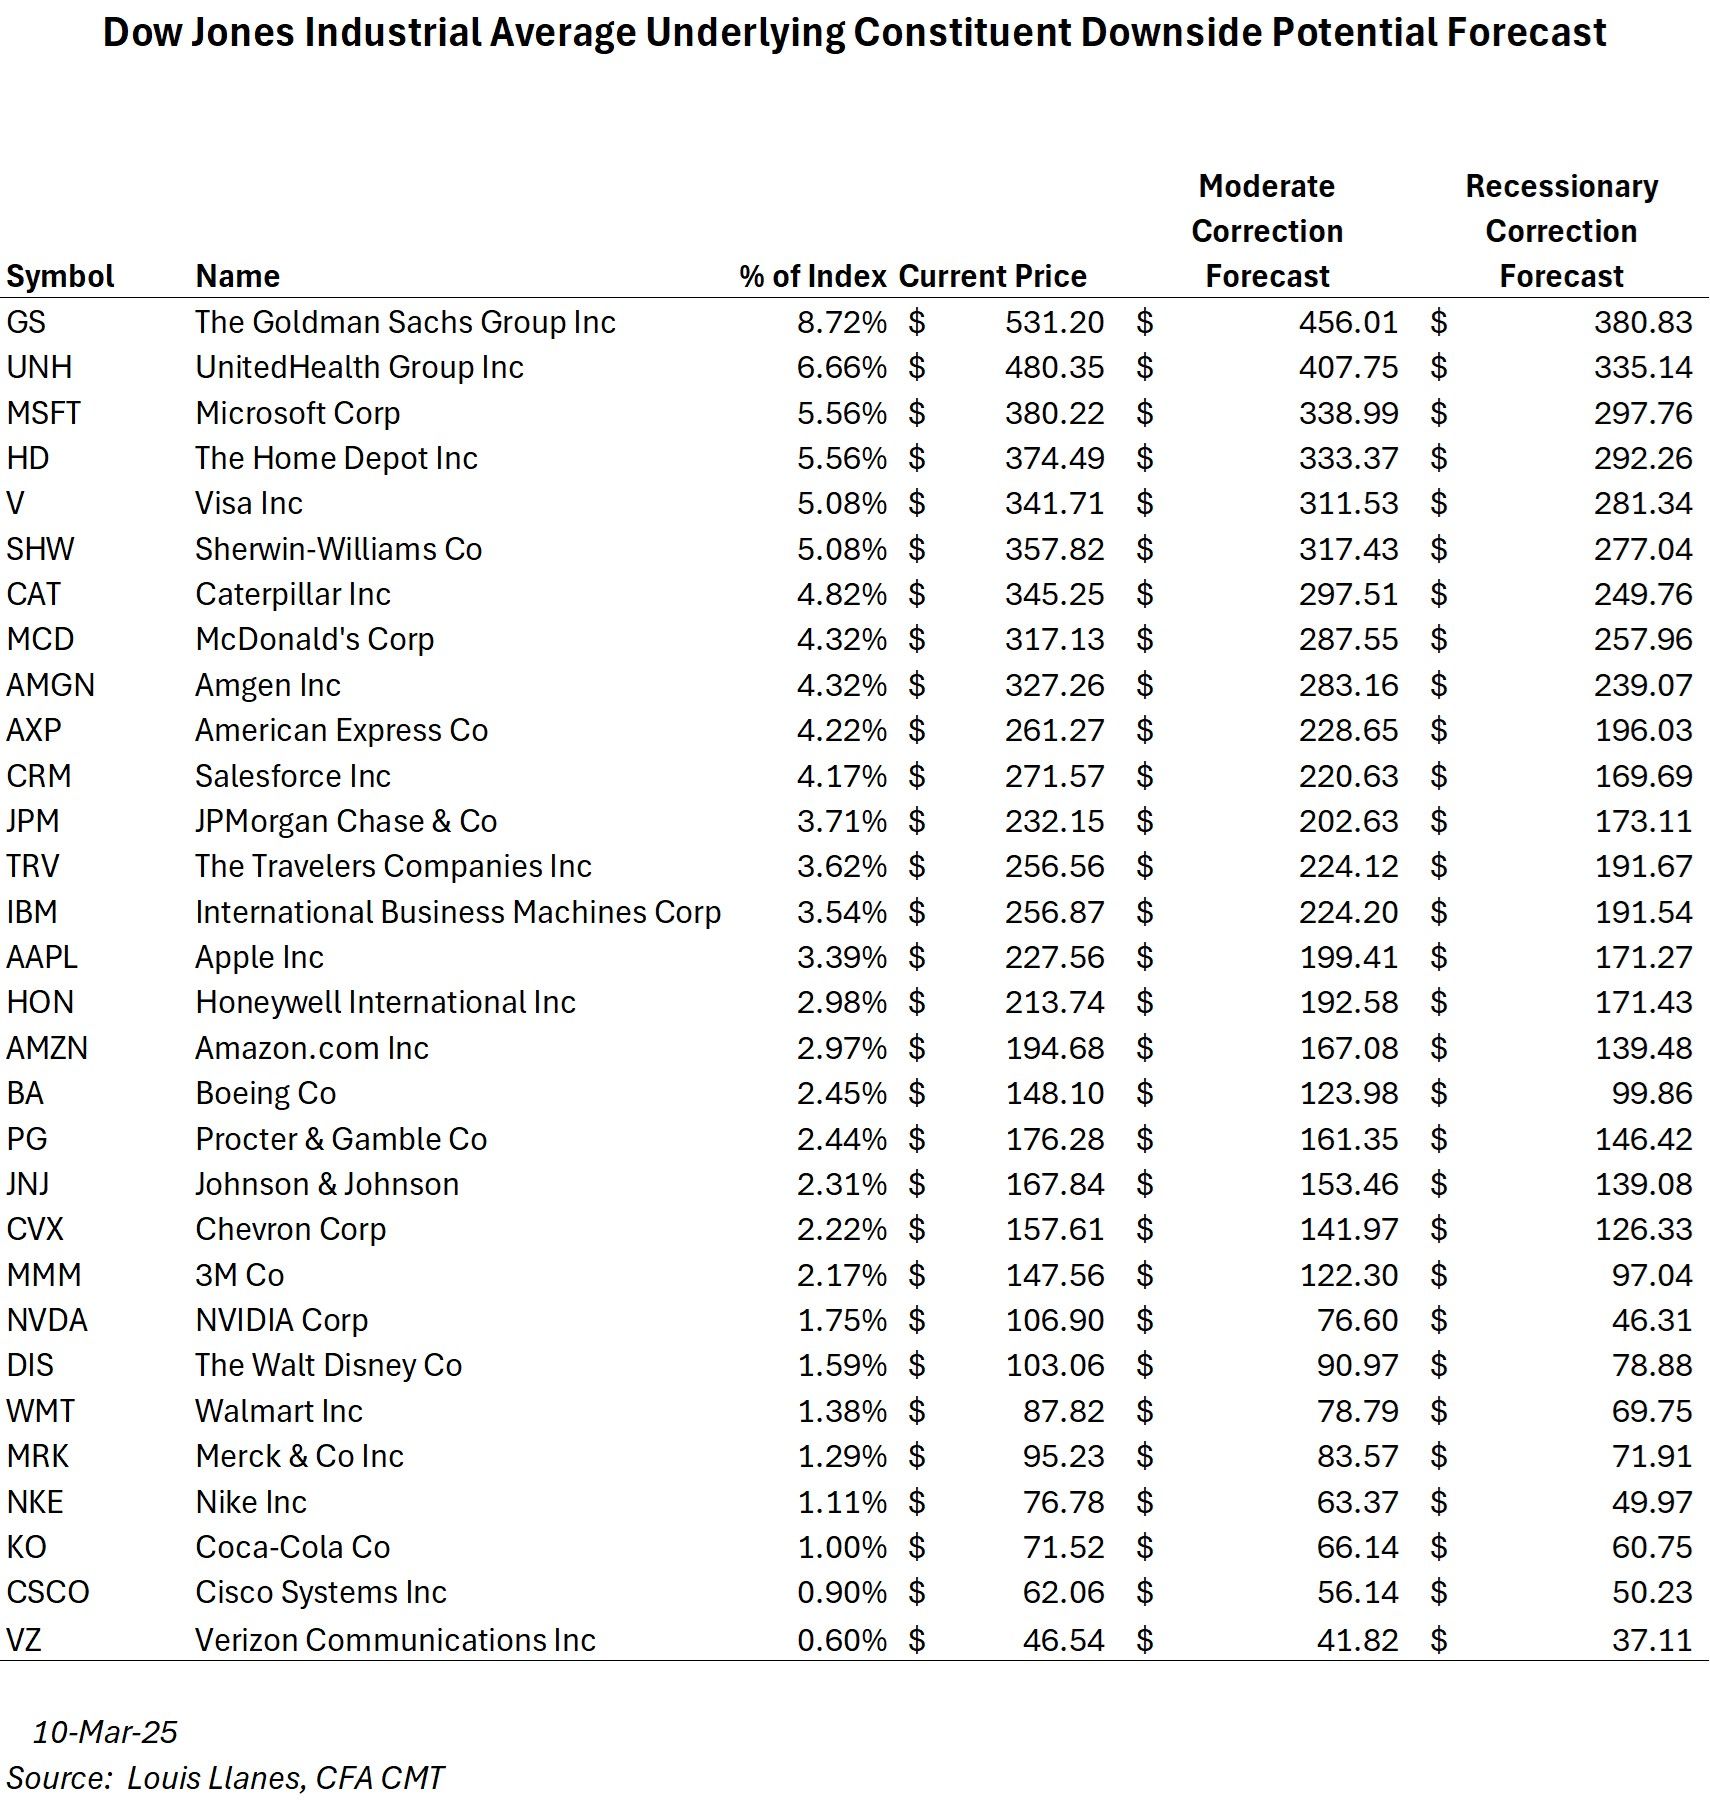
Now to get to the bottom line putting it all together. To forecast the downside risk, using daily volatility, support and resistance levels, and fundamental conditions, I calculated downside targets for each Dow stock under two scenarios:
- Moderate Correction: A typical pullback, not tied to recession, with correlation at 0.70 and a 50% volatility increase, and
- Recessionary Correction: A severe downturn, like the Financial Crisis or Covid-19, with correlation at 0.90 and a 200% volatility spike.
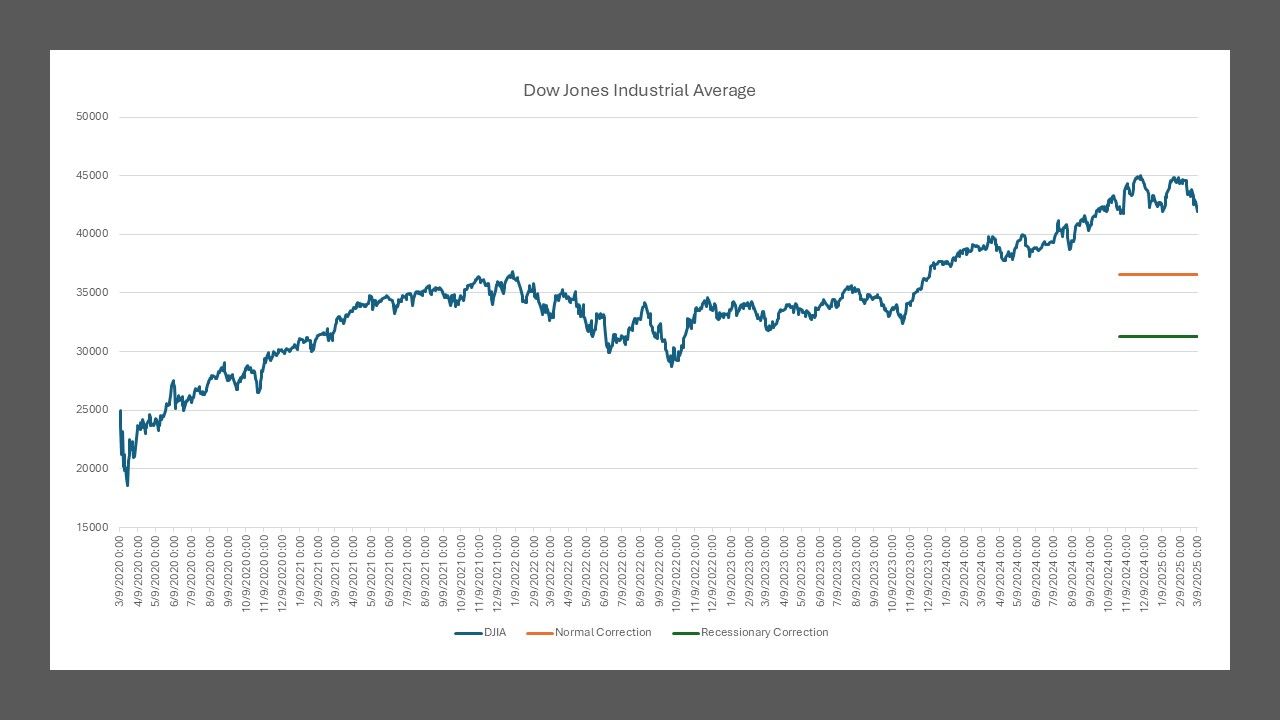
As of March 10, 2025, with the DJIA’s fair value around 41,904, my forecast results are:
Normal Correction 36,592.77 -12.7%
Recessionary Correction 31,281.54 -25.3%
Here Are Some Interesting Points About the Dow That Affect My Forecast
The Dow comprises 30 high-quality U.S. companies, but it’s not the whole market. It’s price-weighted, meaning higher-priced stocks — such as Goldman Sachs GS (8.72% of the index), UnitedHealth UNH (6.66%), Microsoft MSFT, Home Depot HD, Visa V, Sherwin-Williams SHW, and Caterpillar CAT — drive its moves. Its volatility is typically lower than the S&P 500 or broader indexes, but sector dynamics matter. Utilities may see smaller volatility spikes, while tech, financials, and consumer discretionary often face larger ones during corrections
Final Thoughts
My advice? Focus on what you own. Savvy investors can use corrections to buy companies with strong return on capital, reasonable valuations, and growth potential— especially in innovative sectors less tied to geopolitical risks like tariffs. Cash flow correlation matters more long-term than short-term stock price correlation. A diversified portfolio of resilient businesses can weather downturns and thrive on the rebound.
I hope this forecast adds value to your thinking. If you found it useful, follow me for more insights, and feel free to share feedback or questions. I’d love to discuss it further. Here’s to smart investing and prospering on the other side.
