Hindenburg Suggests a Serious Decline. But What Are the Indicators Saying?
When it comes down to it, what matters is how we analyze the indicators.
You've reached your free article limit
You've read 0 of 1 free Pro articles.
There is a lot of chatter lately about the Hindenburg Omen. I have never been a fan of any of these ‘named’ situations in the market. Either the indicators are heading up or are oversold and look to be heading up, or the indicators are heading down.
Yet some time decades ago, someone decided—and here the definition varies so this will not be exact—that if the McClellan Summation Index is heading down and the new highs are contracting and new lows are expanding and the index has to be over the 50-day moving average, then we have what is called a Hindenburg Omen and it portends a serious decline in the next month or two.
There are folks with all sorts of fancy charts showing this, but I go back to: what are the indicators saying?
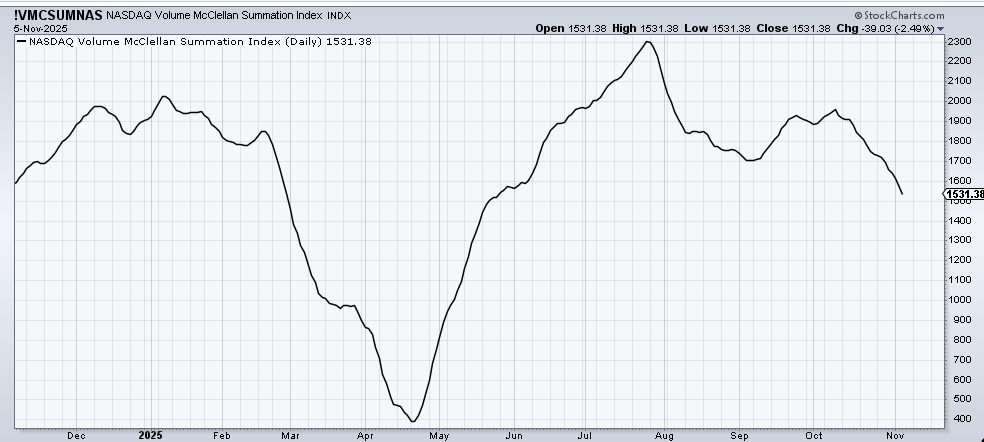
We already have the Summation Index heading down. It has been heading down since July. As a reminder, I view this as a guide to what the majority of stocks are doing. And most have gone nowhere or down for months.
We have looked at the NYSE Summation Index using the advance/decline line, and we have looked at the Nasdaq using volume, but take another look at the Nasdaq using volume because I want you to see that it, too, has been heading down since late July. It has also gone lower than the September low. I consider this indicator to be telling us there has been weakness in the Nasdaq market for months now.
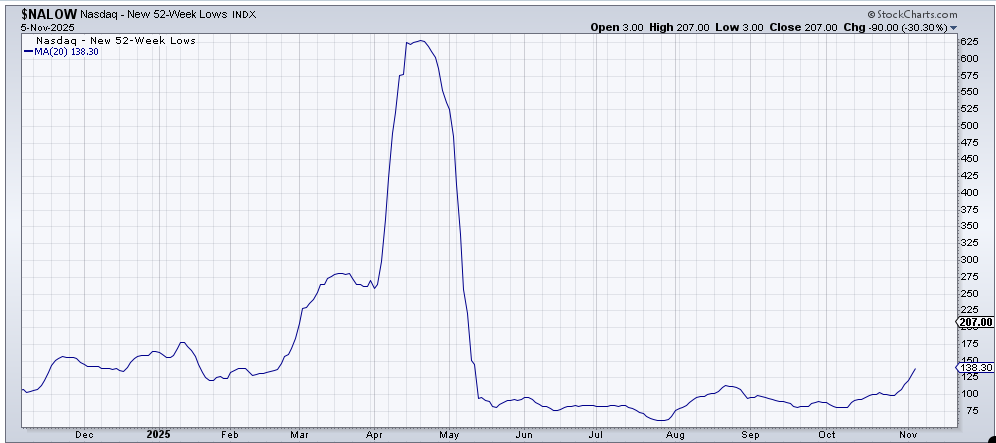
We also know that the number of stocks making new lows on Nasdaq has been increasing, although it did contract on Wednesday. But take a look at the 20-day moving average of Nasdaq new lows, and you will see that it is now the highest since we came off the April low.
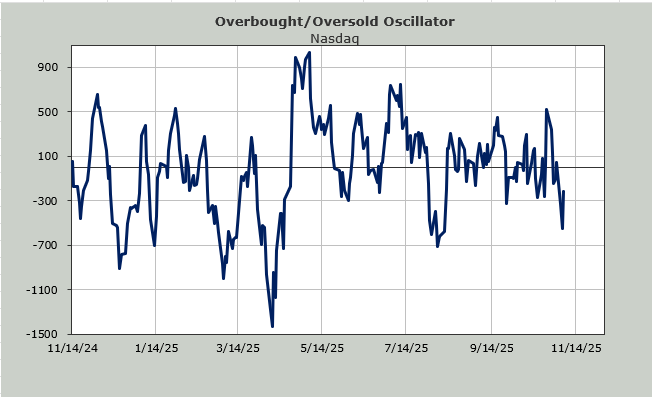
Yet I also know that my own Overbought/Oversold Oscillator, which admittedly is short-term, ought to get back to an oversold condition early next week. Especially if it can see some more negative breadth days in the next few days.
If we get a decline in the coming days, I would expect the VIX to perk up. And I would like to see the put/call ratios show a little fear. But one of the hallmarks of this market since July has been that it doesn’t tend to wait for a good oversold condition and sentiment to get bearish. It just jumps the gun.
In my view, jumping the gun might be great for those who just get long and stay long the index, but under the surface, there has been a lot of nothingness and a lot of sloppiness. So if we jump the gun, we’ll just end up with more of the same. Which is a group rotation rally that lasts a week, and that’s that.
