Here's How Tariffs Are Impacting Leading U.S. Commodities So Far
As the Trump administrations restructures the economy, everything from soybeans to silver are feeling an impact.
You've reached your free article limit
You've read 0 of 1 free Pro articles.
If trading were as easy as acting on the mainstream take, everyone would do it. Ironically, the consensus analysis is often the view that proves incorrect with time. In short, if everyone in the room thinks the same thing, then no one is thinking at all.
The Trump administration is attempting a generational economic restructuring, and nobody knows how it will pan out. It could be a complete disaster, but there is a chance it isn’t. Nevertheless, there will be no litmus test or crystal ball to help us confirm the outcome today; yet market participants are placing their wagers. Let’s look at how some markets are faring.
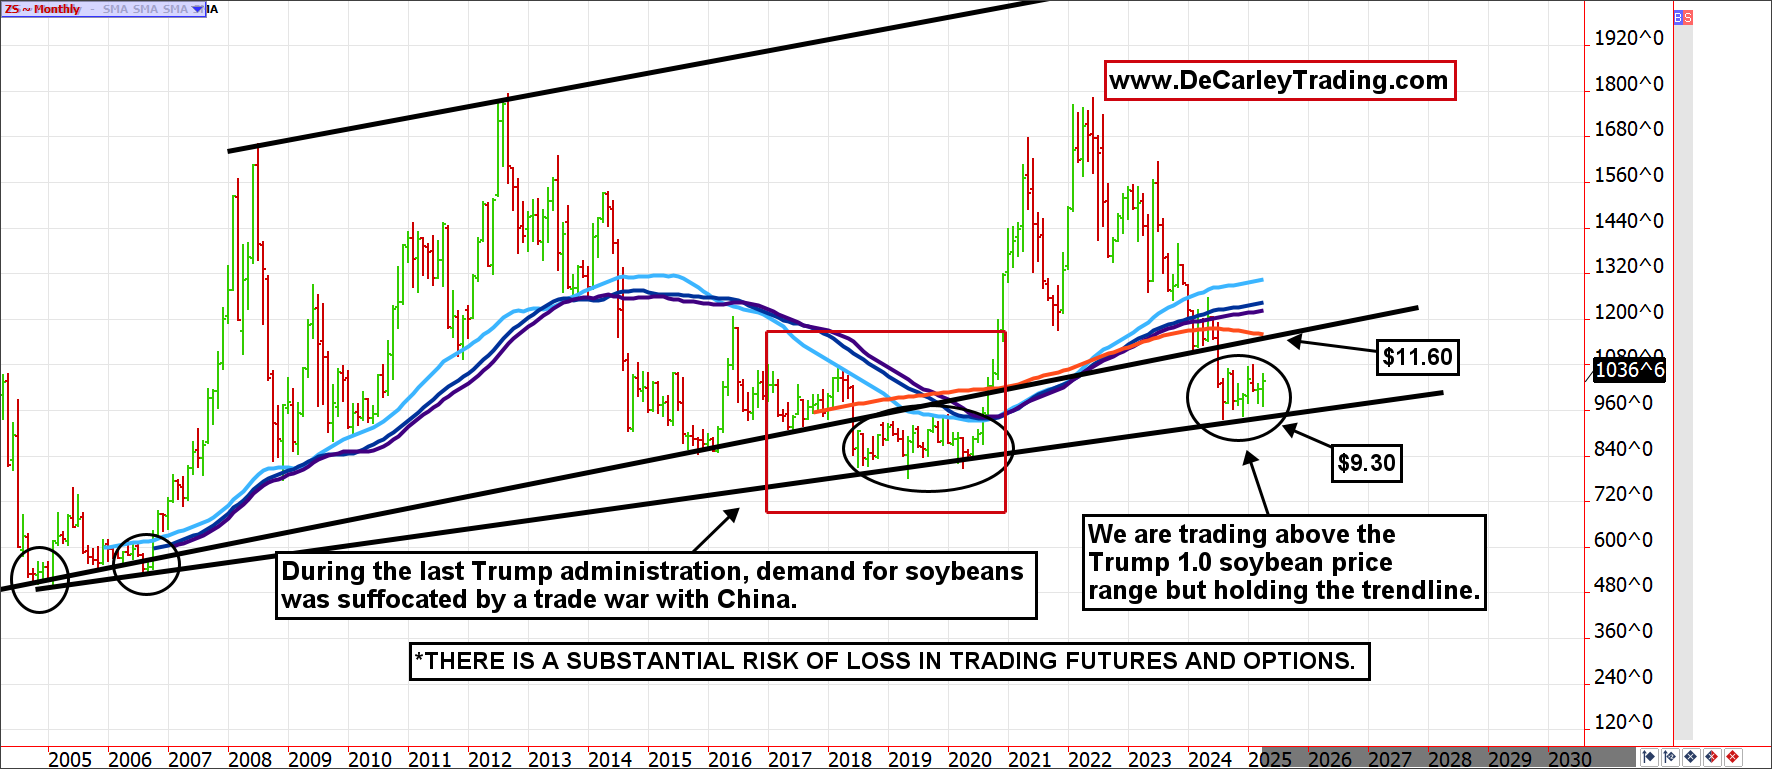
Soybeans
This isn’t the first trade war with China. During Trump 1.0, we went through the same thing, but it wasn’t as broad.
U.S. grains and grain prices were among the most impacted in the first go-around. The back-and-forth negotiations went on for years, not weeks or months. So, we should keep our expectations tempered. In essence, bean traders had “been there and done that,” which allowed the market to price in the negative impact in advance.
We doubt soybeans can put a full-fledged rally together, but we also doubt the multi-decade trendline near $9.30 will be broken either.
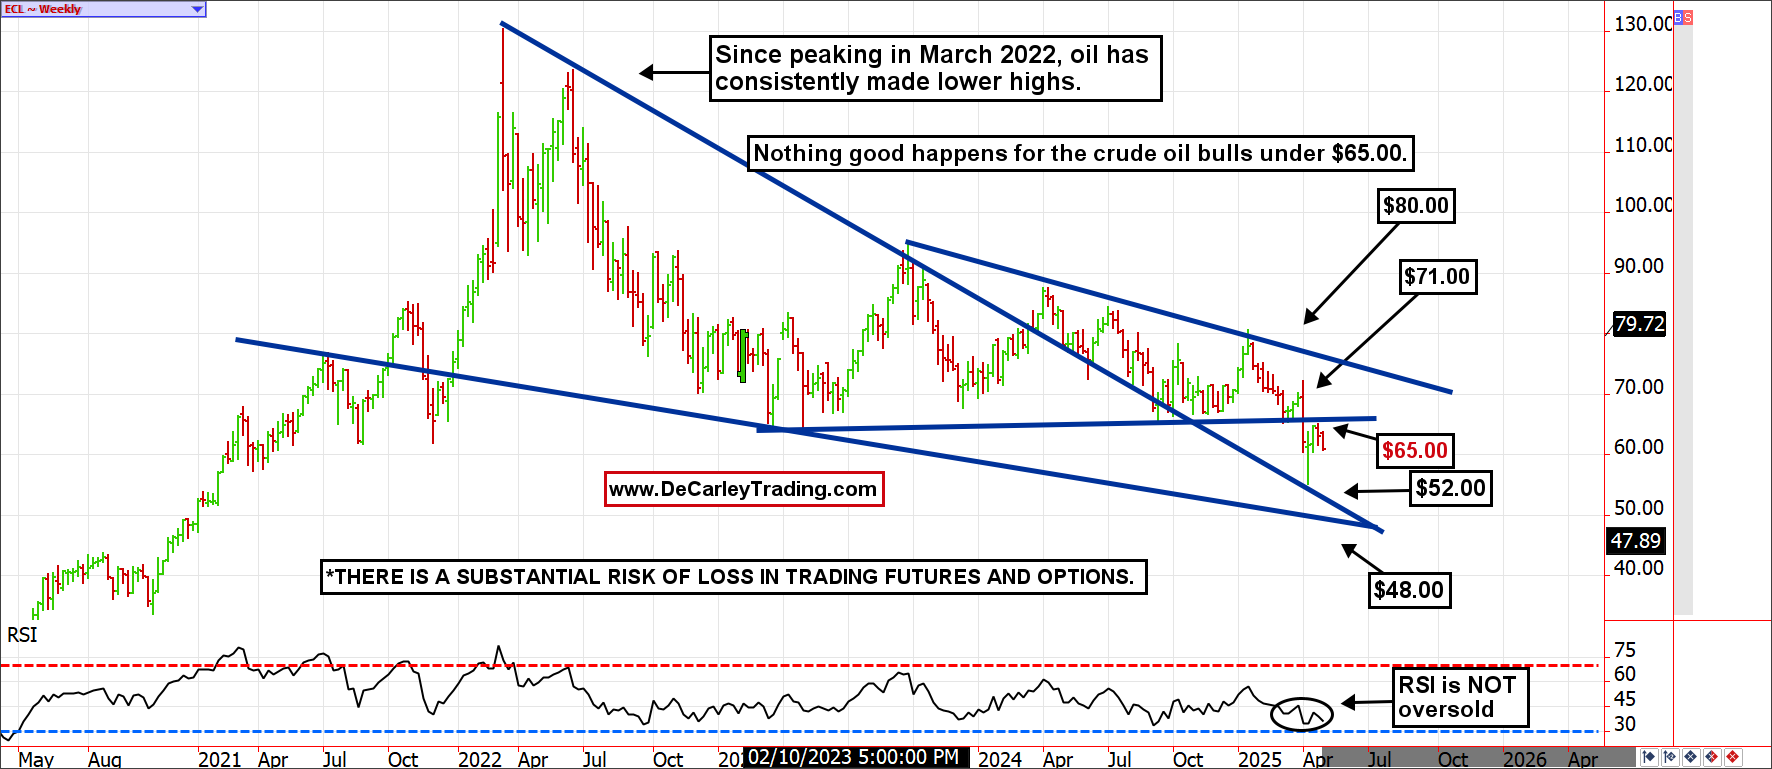
Crude Oil
The most notable impact that tariffs will have on oil isn’t an import tariff (we can mostly meet our own energy needs if we must), but the destruction of energy demand as businesses and consumers pull back due to uncertainty. The current tariffs imposed on Canadian oil are set at 10%, and Mexican oil at 25%; however, the Canadian tariff can almost be overcome by the weakness in its currency following the announcement. Further, for the U.S., importing oil is somewhat optional.
We have a hard time seeing oil getting off the mat in the face of the tariff war. The disruptions of tariffs have increased expectations for a recession, which results in energy demand destruction. The jury is still out, and such outlooks are as temporary as prices are, but the trend is obviously pointing toward lower economic growth and lower oil demand while the world works out its differences. Lastly, the fact that crude oil has been trading lower in lockstep with the U.S. dollar, as opposed to trading inversely, is a sign of underlying weakness.
In a pre-U.S. tariff world, OPEC had been sacrificing market share (production) to keep the floor in oil prices near $65.00, but without the “OPEC put,” gravity is likely to continue to pull prices down. It should be noted that during Trump 1.0, oil spent most of its time sub-$65.00; it is too early to declare this scenario will repeat, but either way, that level will play a significant role in the price discovery process.
The oil market consistently found buyers near the $65.00 level for over two years until it didn’t. If we are right about the bear market continuation, the previously supportive level ($65) should be the new ceiling with $52.00 as a potential downside target, and perhaps even $48 is in play if selling gets out of hand. We admittedly still have PTSD from the 2014 and the 2020 oil sell-offs. In both instances, the market traded with low volatility and stable pricing for a few years before falling off a cliff. If we repeat that pattern, this sell-off isn’t done yet.
Natural Gas
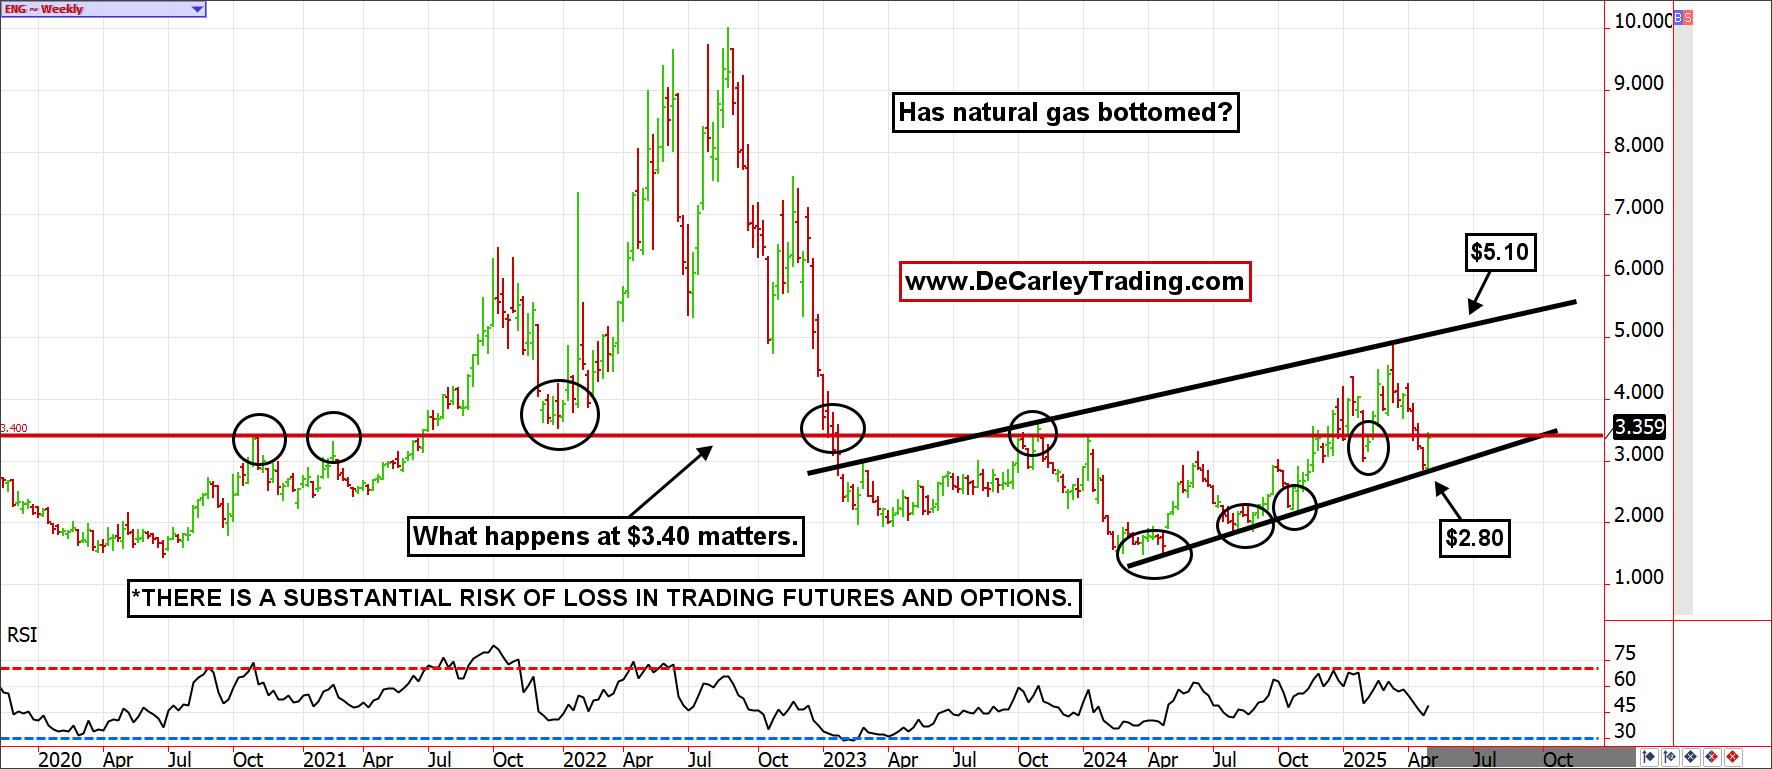
Mild weather and a chronically well-supplied market allowed natural gas prices to slip over $2.00 from the recent high. However, the selling was likely exacerbated by the potential and reality of retaliatory tariffs on U.S. liquefied natural gas by countries such as China and Canada.
Yet, natural gas futures have put together an impressive showing since Monday morning. We believe this week’s natural gas rally is sustainable and likely something to be built upon. Last week’s lows represented a full round-trip retest of the December breakout from a downtrend line (previous resistance at the downtrend line is now acting as support). The selling also brought the relative strength index (RSI) into oversold territory during what is often bullish seasonality. Further, with the May futures contract dropping off the board, we suspect the timing is ripe for a trend change. To confirm, we need to see a close over the 200-day moving average near $3.40.
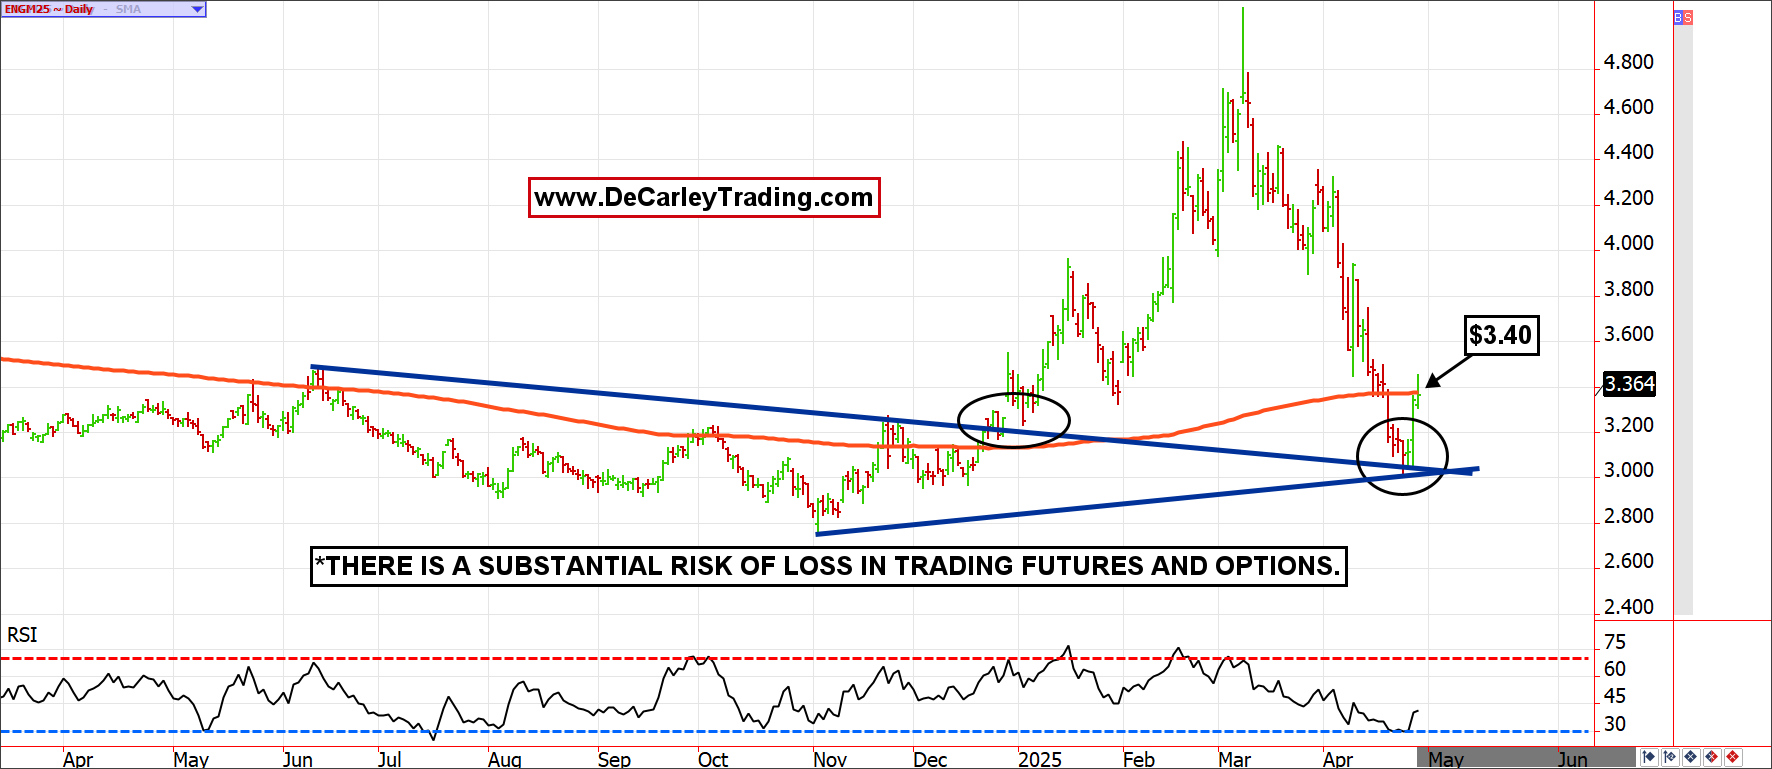
In addition to being the 200-day moving average, $3.40 has been a price level that has sparked market reaction. In short, the market is bullish above and bearish below.
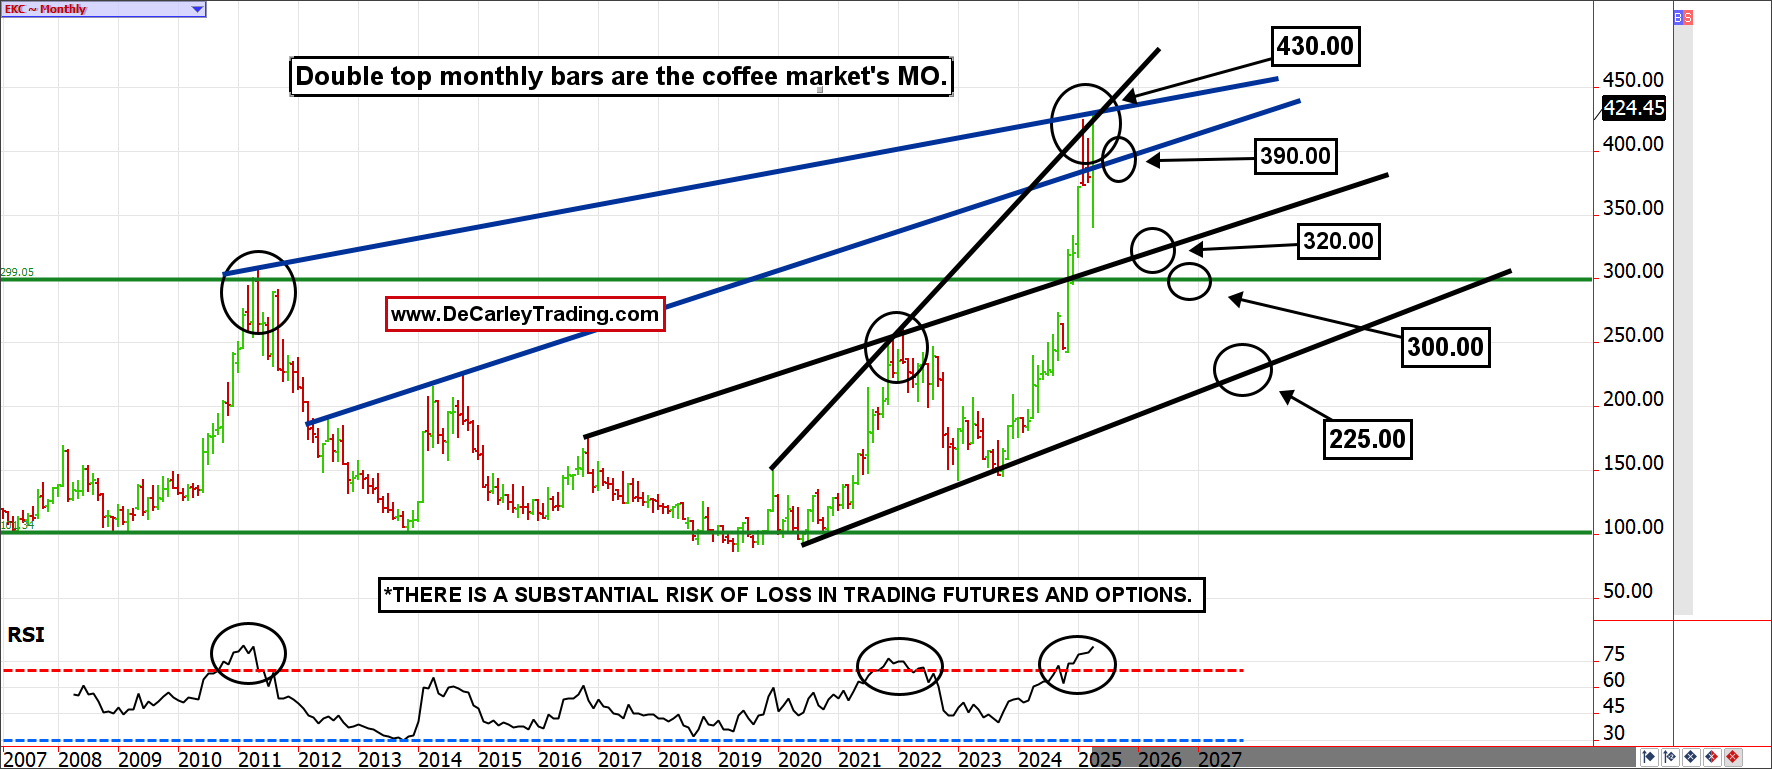
Coffee
Coffee futures have experienced historical volatility; ironically, most of the chaos occurred well before tariffs were part of the equation. The crisis at the forefront is a vast threat to coffee production due to disease and drought. Yet, the potential for U.S. tariffs to hit coffee prices has exaggerated the rally and likely kept it alive longer than would otherwise be the case.
At the moment, market participants are doing a lot of guesswork to determine how this grinds out (pun intended). Still, the U.S. administration seems to be offering relief to products that cannot be produced in the U.S. Due to the climate needs for growing coffee beans, it seems to fit into that category. Yet, we don’t know until we know, which is stressful and hectic. But we know how the market has behaved in the past. Coffee has habitually posted two monthly bar extensions with the RSI in overbought territory before rolling over. This time is rarely different, but it always feels like it is in real-time.
Silver
We rarely talk about silver because it is a downright awful market on most fronts. For long-term investors, it has been a portfolio dog for almost 15 years, and in the decades before, it wasn’t that great either. This is probably because it is a market with both precious metal and industrial uses; any flight to quality buying appears to be offset by bearish sentiment in industrial metals.
Since the 2011 high of $50.00, buy-and-holders have likely suffered emotionally and financially. I suspect active traders haven’t fared any better, due to the stop-and-lurch nature of price action. In silver, it is easy to get caught in the wrong place at the wrong time. Even so, this is a market that many traders follow and inquire about, so we are compelled to share the latest monthly chart.
If we pretend the 2011 parabolic rally didn’t happen, the top of the trading channel for silver would be roughly $34.00, and the post-2011 blow-off top ceiling was $35.00. If silver couldn’t break through these resistance levels while gold was the most sought-after asset on the planet, it probably won’t. Unless silver manages to break $35.50 in the coming weeks, the most likely scenario is a return to sub-$20.00.
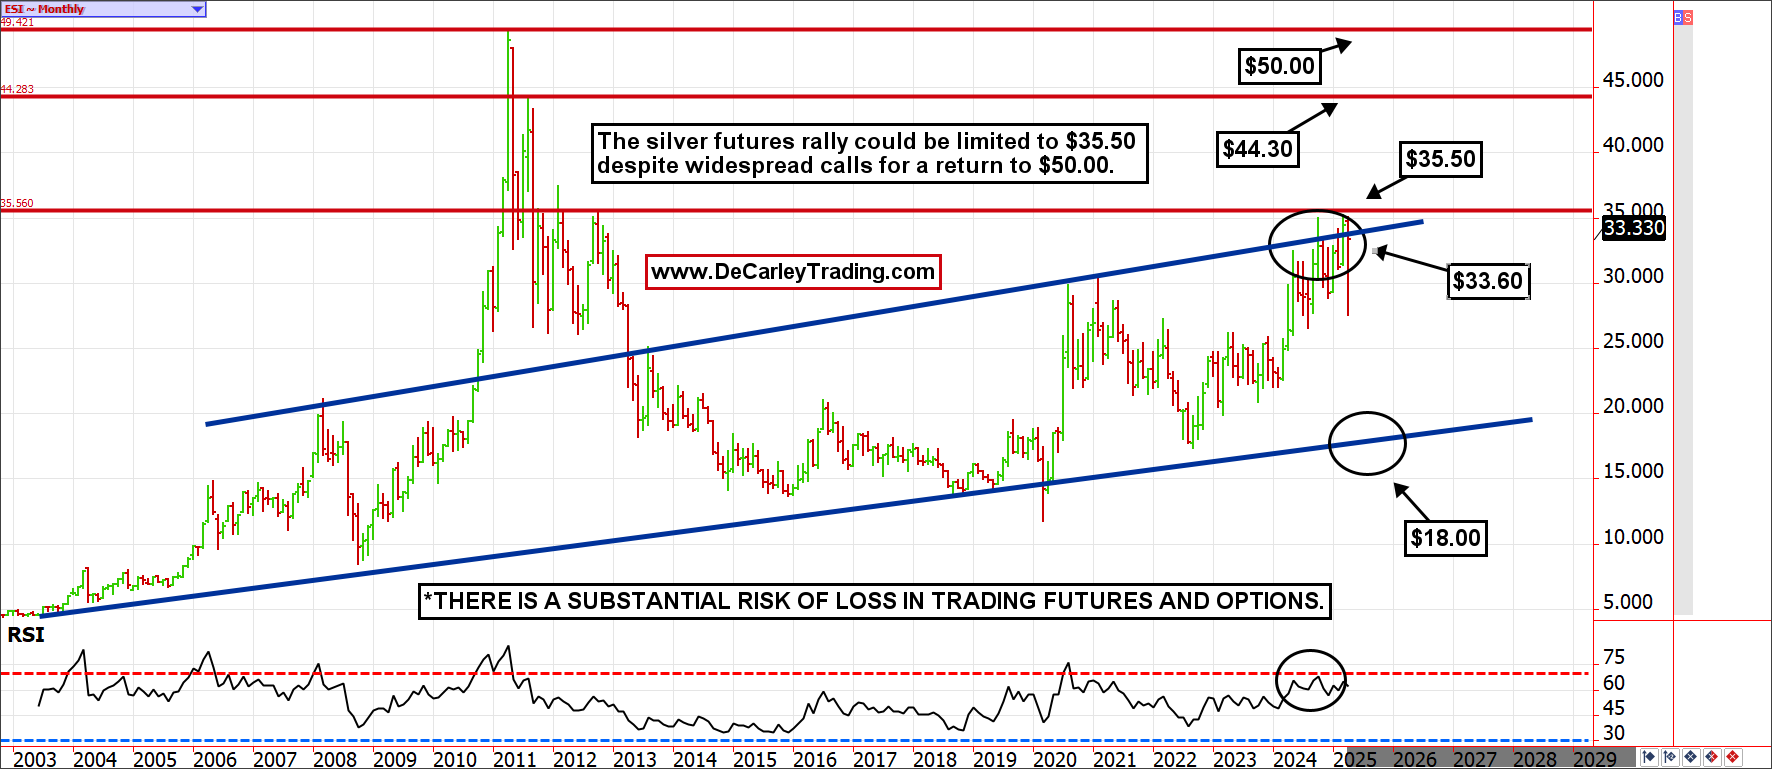
Expectations exist that the spread between gold and silver must narrow to normalize; the current path is unsustainable. This is probably true, but there is no guarantee that the spread will revert to a more normal state by means of a silver rally. It could result from a reversal in the complex in which gold underperforms silver.
