Giddiness Denied: What the AAII, ISE Ratio, and Breadth Say About the Next Week
It’s hard to get giddy when tech acts so poorly. Meanwhile, if the SOX goes on an 'island retreat' investors may not enjoy the vacation.
You've reached your free article limit
You've read 0 of 1 free Pro articles.
I believe, had the rally that began in the morning on Thursday, managed to hold on we might have gotten sentiment into the giddy camp. But the dripping in the afternoon likely kept that from occurring.
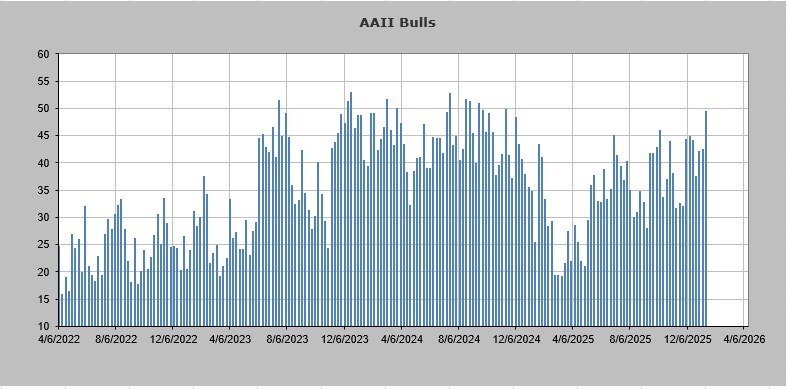
But we did get that ISE Equity call/put ratio over 3.0 earlier this week, which I said was a sign of giddiness. We did see the folks at the American Association of Individual Investors (AAII) chime in with 49.5% bulls. That might not seem like a lot but it was the highest reading for the bulls in 14 months. As you can see, they don’t often throw caution to the wind and push up into the 50% zone, but they have gone there now.
So, no, I don’t think we got fully giddy. I think I’d call it very complacent.
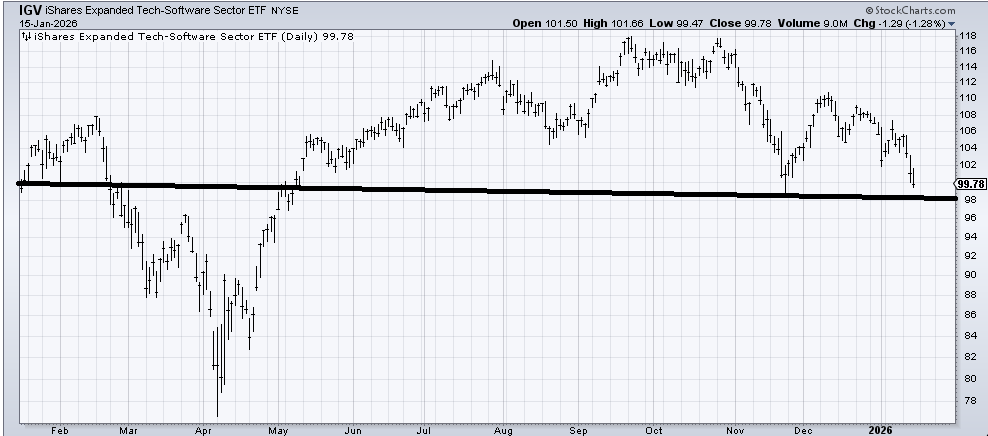
But you see it’s hard to get giddy when tech acts so poorly. Software tried to rally and couldn’t hold it. Nor could it manage to get down to that support line I drew in Thursday around 98 on the (IGV) chart. As a reminder, I would expect a short-term bounce off that level should it get there.
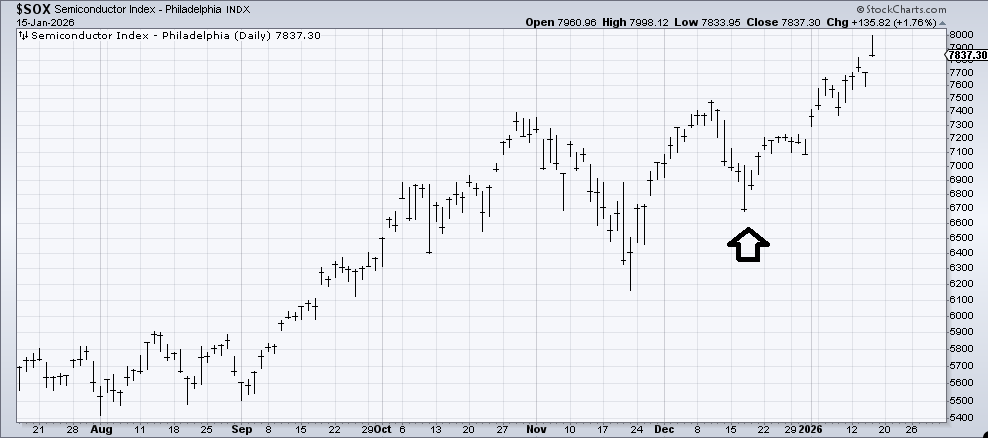
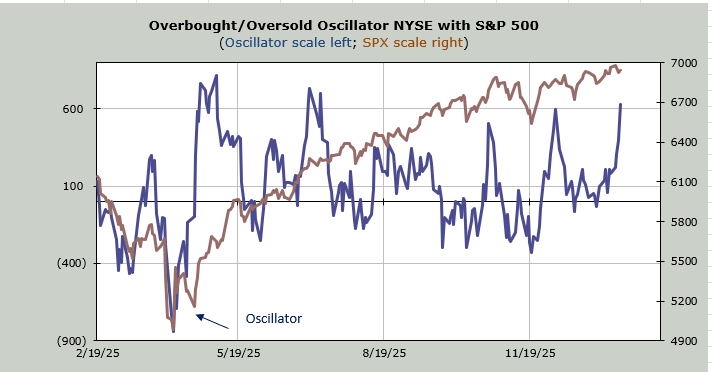
As for the SOX, you might recall I said it got oversold right there at the arrow. Well actually I thought it was oversold the day before it took that plunge. Either way, it has not gotten to any sort of extreme overbought yet. However, the action on Thursday bears watching because if there is any follow through, especially if it gaps down and leaves Thursday’s action as an island, that would be a problem.
For now I think we are overbought, especially the 493. My own Overbought/Oversold Oscillator is based on the net of the advance/decline line. It is a 10-day moving average so we look back at what we're dropping over the last 10 trading days. The chart shows us up at the highs, and therefore overbought.
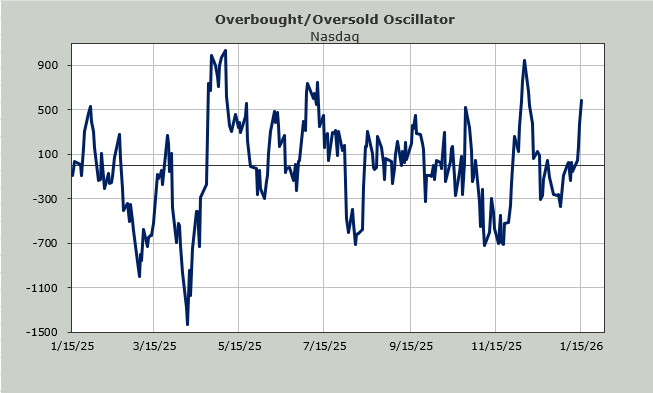
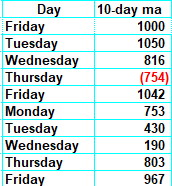
Then we look at the numbers we are dropping. A long string of positive numbers means we are overbought. A long string of red ones means we’re oversold. In the last 10 trading days the breadth has been positive for nine of the 10 days. That’s what makes us overbought. Here are the numbers we are dropping beginning Friday.
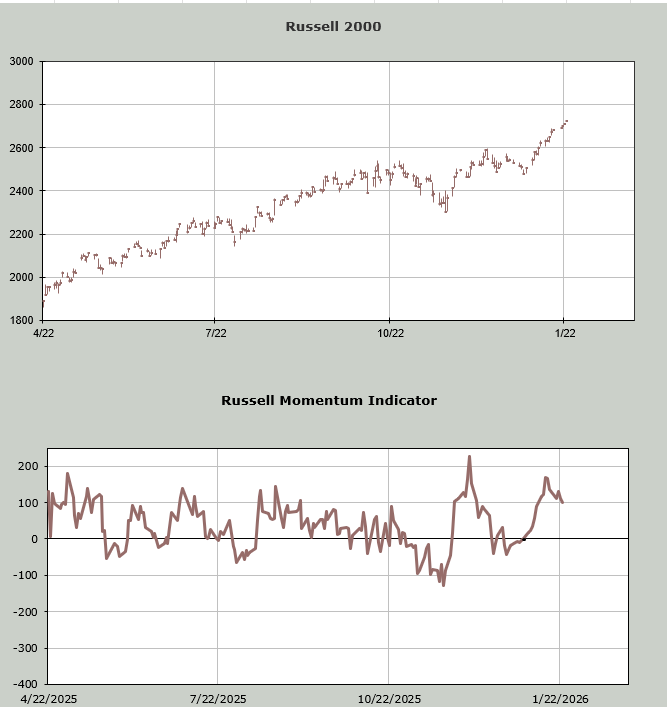
If you prefer price, we can use the Russell 2000 Momentum Indicator. What I do here is plug in higher prices (closing basis) to see when the indicator stops going up or goes down. You might recall as we headed into Christmas week I did this same exercise, only I plugged in lower prices and looked for when the indicator turned up. Now we have a situation with higher prices plugged in and the indicator goes down.
Remember this is not meant to find the exact day, just the general time frame. And I feel we are here now. I’m looking for an overbought pullback and another move up in the VIX over the next week. It would be great if such a pullback would give the charts some better setups.