Friday's Rally Might Not Be What It Seemed
TheStreet Pro's technician Helene Meisler asks a key question about Friday's rally, so let's tackle it; also, let's chart the market and see why Nasdaq looks a bit ... troubled.
You've reached your free article limit
You've read 0 of 1 free Pro articles.
Helene Meisler asked the question in her Sunday night piece here at TheStreet Pro. It was the question that needed asking. She wrote out loud precisely what at least some of us had been thinking about for two days. In regard to Friday's face-ripping rally across higher beta or high-risk assets: "was it a short covering rally (within a bearish move) or was it real buying?"
Helene had said earlier in the week that the Nasdaq-based equity indexes and certain tech stocks specifically could become technically oversold by Friday and she nailed it.
The rally on Friday was overwhelming and encompassed nearly every corner of the equity market. The S&P 500 took back key technical levels. That was awesome, at least for those of us that had been slapped around a little earlier in the week. Still the Nasdaq Composite did not quite take back those same levels. Additionally, aggregate trading volume ebbed significantly on Friday. Fewer shares changed hands on Friday across both the S&P 500 and the Nasdaq Composite with the market in rally mode than had changed hands on either Tuesday, Wednesday or Thursday.
Was that meaningful? I sure think it was. Helene quoted Bob Prechter, who once said, "all rallies begin with short covering." That, to some degree, is often true. I would point out that the contraction in aggregate trade did prevent Friday from "officially" being labeled as a "Day One" bullish reversal of trend. Does that mean that there won't be any carry over into this week as the masses rise from their Super Bowl-induced torment to get to work on Monday?
No. It does mean that at least Monday could be more of a "jump ball" than some might have thought as Friday eased to some degree, the pain felt across some parts of the marketplace last week. Helene tells her readers to focus on the short-term. I could agree with that and add that narrowing one's book during times of increased uncertainty might not be a bad idea. Strict discipline around target prices and panic points also never hurt anyone too badly. My opinion. Play ball but respect the 8% rule. It's there for a reason.
Meltdown?
Once the past week was "in the books" it looked a lot less awful than it had during the week. The Street of Wall suffered for several days, a drubbing focused on tech stocks, growth stocks and stocks bearing excessive metrics for valuation as well as Bitcoin. At the same time, capital sought refuge in traditional safe-haven assets like U.S. Treasury debt securities and defensive type sectors or those labeled as "value" stocks.
The macroeconomic data was mixed for the week. While purchasing managers surveys showed strength across both the U.S. manufacturing and services sectors, there was, as we had talked about, some weakness in labor market-focused data. While the ADP Employment Report for January disappointed, so did the December JOLTs report on job openings and job quits and so did the weekly release on state level filings for unemployment benefits.
What do we now know, or at least think? For one, capital spending on the further development and scaling of artificial intelligence and the provision of electrical power that this scaling requires are what is going to be keyed on by investors. That will almost certainly be a bumpy road that will at times rattle cages in previously unexpected ways. We also learned that software stocks, where there truly is an underlying threat of industry-wide disruption by this AI, can and will have a broadening impact on other areas of technology, such as graphics processing units, central processing units, and memory or storage, despite that demand for those kinds of products has forced global shortages.
Proverbs 27:1
"Do not boast about tomorrow, for you do not know what a day may bring."
The Week That Was...
How sloppy was it? As mentioned above, the final scorecard was not that awful, but relying upon the numbers fails to tell the story in a coherent way. After understanding that, this is how equity markets performed over the past week...
- The S&P 500 gained 1.97% on Friday but still gave up 0.1% for the week.
- The Nasdaq Composite rallied 2.18% on Friday, still losing 1.84% for the week.
- The Nasdaq 100 ramped 2.15% higher on Friday to lose "just" 1.87% on the week.
- The Russell 2000 soared 3.6% on Friday and 2.17% for the week.
- The S&P Small Cap 600 popped for 2.74% on Friday and an impressive 3.95% for the week.
- The S&P Midcap 400 gained 3.07% on Friday and screamed 4.36% higher for the week.
- The Dow Transports gained 1.77% on Friday and a stunning 8.7% for the week.
- The Philly Semis ran an incredible 5.7% on Friday, added just 0.63% for the week.
- The KBW Bank Index added 2.73% on Friday and a truly radical 5.08% for the week.
On Friday, 10 of the 11 S&P sector SPDR exchange-traded funds closed out the session in the green, led by Technology (XLK) and followed by the Industrials (XLI) and Materials (XLB) . Only Communication Services (XLC) gave up ground for the day.
For the week, surprisingly, eight of the 11 S&P sector SPDR ETFs traded higher, with the staples (XLP) way out in front, followed again by the industrials and materials, suggesting improved economic activity. Communication services, which is where the internet lives, was again, the big loser.
The Charts
Note that as the S&P 500 sold off throughout the week, that even though in hindsight, we can label last Wednesday as a bearish "Day One" reversal of trend, that there never really was a necessary "pause" until Friday, and that trading volume ebbed throughout the balance of the week.
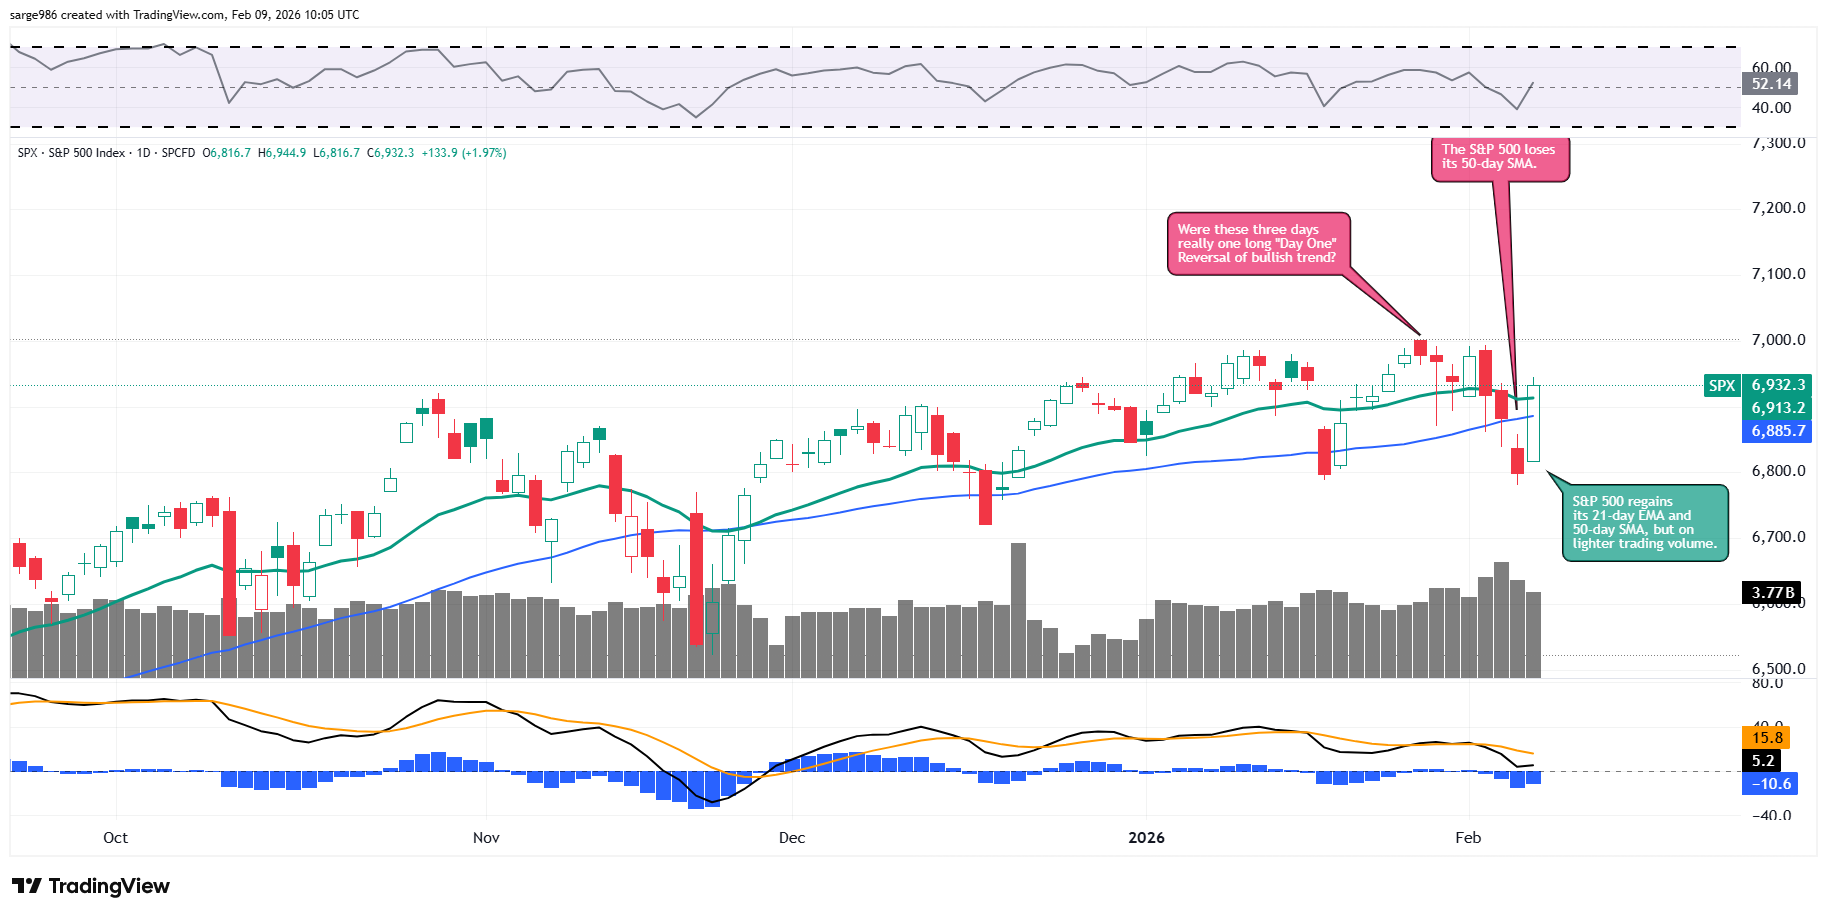
This does, to a degree render the loss of and the regaining of key levels, less technically significant than these moves would have otherwise been. Looking at the indicators, relative strength is just around neutral, while the daily moving average convergence divergence has suffered a couple of obvious setbacks. That said, neither the 12-day exponential moving average nor the 26-day exponential moving average is in negative territory.
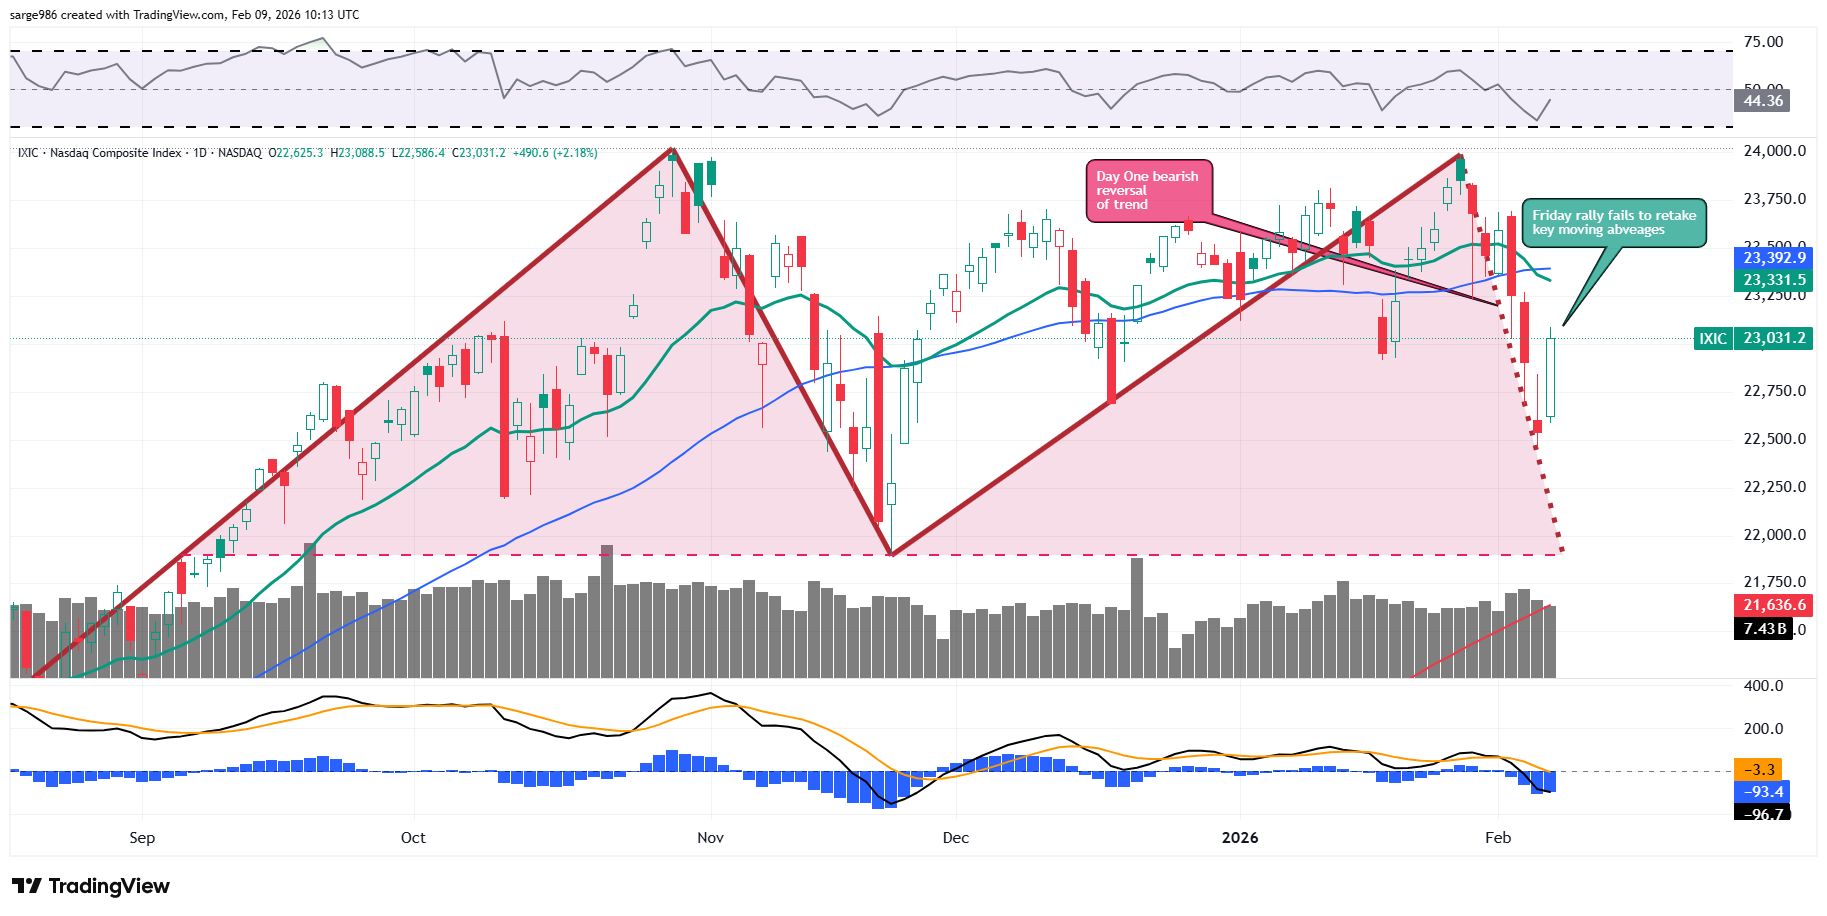
The chart of the Nasdaq Composite is clearly more troubled than is the chart of the S&P 500. The Friday rally on this chart does potentially look a bit more like a pause than it does for the S&P 500 as no key moving averages were retaken. This makes Monday and maybe even Tuesday hugely important for U.S. stocks. The double-top pattern seen here is still in effect and the daily MACD, below the chart, is still overtly bearish in posture.
Earnings
As of Feb. 6, according to FactSet, for the fourth quarter, Wall Street sees a year-over-year blended (results and projections) earnings growth for the S&P 500 of 13%, up sharply from 11.9% last week, and up sharply from 8.2% the week prior. Wall Street also sees revenue growth of 8.8%, up from 8.2% a week ago. Simply put, despite the stock market volatility, corporate execution has been excellent.
With 359% of the S&P 500, 76% of S&P 500 member firms have reported earnings beats while 73% have beaten consensus for revenue generation. For the full year (2025), the street now sees earnings growth of 13.5% on revenue growth of 7.4%. For the full year 2026, the street now sees earnings growth of 14.1% on revenue growth of 7.3%.
At the moment, Technology, at earnings growth of 30.4% and the industrials at growth of 23.3% as well as communication services (+13.9%) are the only sectors projected to experience double-digit bottom-line growth for the fourth quarter. Presently, just two sectors (discretionaries and health care) are projected to suffer a year-over-year earnings contraction as energy has escaped that grouping.
Valuation
Still using data provided by FactSet, the S&P 500 ended last week trading at 21.5 times twelve months' forward-looking earnings, down from 22.2 times a week ago. This is well above the five-year average of 20.0 times for the index as well as well above its ten-year average of 18.8 times.
The S&P 500 also ended last week trading at 27.9 times trailing twelve months' earnings, down from 28.6 times. That also stands well above the five-year (24.9 times) and ten-year (23.1 times) averages for the index.
Nine of the 11 sectors are still trading above their five-year average valuations, led by consumer discretionaries (27.7 times), Industrials (25.6 times) and tech (23.8 times). Only the utilities (at 17.9 times) and the REITs (at 17.6 times) are not historically overvalued relative to their five-year averages.
Silence
'T is better to sit here beside the sea,
Here on the spray-kissed beach,
In silence, that between such friends as we
Is full of deepest speech
- Paul Laurence Dunbar, 1913
The GDP Game
Last week, the Atlanta Fed left their GDPNow model estimate for Q4 economic growth unrevised at growth of 4.2% (q/q, SAAR). Among other regional central bank district branches running close to real-time Q4 GDP models, the New York Fed revised their Q4 model lower to growth of 2.69% from 2.74%.
The Cleveland Fed left their model unrevised, at growth of 3.08% as well. The St. Louis Fed, which has been quite a way off on a regular basis throughout 2025, also left their estimate where it was, at growth of 0.1%. Though in positive growth territory for two weeks now, St. Louis remains the outlier.
Fed Funds Futures
Fed Funds futures trading in Chicago are currently pricing in a 15.8% probability for a quarter percentage-point rate cut at the next Federal Open Market Committee policy meeting on March 18, up from 14.9% a week ago. The next rate cut is priced in for June 17 at this point (71% likelihood). At present, there is still a half percentage-point worth of additional rate cuts fully priced in (72% chance, up from 70%) for all of calendar 2026.
On The Docket...
The week ahead will likely be difficult. Markets may behave more in line with where technical analysis might lead now that a fundamental reality check has been forced upon certain names. Let's get into it.
.... Our central bankers will be active this week. Later on Monday, we'll hear from Fed Gov. Christopher Waller, Atlanta Fed Pres. Raphael Bostic and Fed Gov Stephen Miran (twice). Atlanta does not vote on policy this year. Both Waller and Miran are currently seen as dovish. On Tuesday, both Cleveland Fed Pres. Beth Hammack and Dallas Fed Pres Lorie Logan will speak publicly. Hammack is seen as extremely hawkish. Both Hammack and Logan hold voting rights for 2026. As the week progresses, we'll hear from Fed Gov Michele Bowman before circle back to Logan and then Miran.
.... The macroeconomic calendar will be very active this week. Wednesday will be "the big" day. That's when the Bureau of Labor Statistics will publish its (almost always highly inaccurate) results for January employment surveys, delayed from last Friday due to the government shutdown. This will not be the only high profile macro event of the week, though.
Tuesday morning brings December retail sales, as Wednesday afternoon will bring a public auction of $42 billion worth of new U.S. Ten Year Notes. On to Thursday for January existing home sales and then Friday for the January consumer price index. I am projecting a noticeable slowdown in year-over-year consumer-level inflation for January and for the first half of 2026 as well.
.... The earnings calendar will be very active again this week, but there will be nowhere near the number of high-profile large caps reporting that we have seen over the past few weeks. On Tuesday, Coca Cola (KO) and Hasbro (HAS) will go to the tape followed by Ford Motor (F) that afternoon. Wednesday morning, CVS Health (CVS) , McDonald's (MCD) , Shopify (SHOP) and T-Mobile (TMUS) will report, followed by Cisco Systems (CSCO) after the close.
On Thursday morning, we'll hear from Zoetis (ZTS) . That evening, Airbnb (ABNB) , Applied Materials (AMAT) , DraftKings (DKNG) , Roku (ROKU) and Twilio (TWLO) will all post their performance. The week finally simmers down on Friday as Advance Auto Parts (AAP) and Wendy's (WEN) report.
Economics
(All Times Eastern)
No domestic macroeconomic data scheduled for release.
The Fed
(All Times Eastern)
1:30 p.m. - Speaker: Reserve Board Gov. Christopher Waller.
2:30 - Speaker: Reserve Board Gov. Stephen Miran.
3:15 - Speaker: Atlanta Fed Pres. Raphael Bostic.
5:00 - Speaker: Reserve Board Gov. Stephen Miran.
Today's Earnings Highlights
(Consensus EPS Expectations)
Before the Open: (BDX) (2.81), (CLF) (-.62), (KDP) (.60)
After the Close: (GT) (.49), (ON) (.62)
At the time of publication, Guilfoyle had no position in any security mentioned.
