Four Important Charts to Watch
During this sideways chop-fest, there have been a handful of charts I've focused on. These are a few of them.
You've reached your free article limit
You've read 0 of 1 free Pro articles.
Within this chop-fest we have been in, there are a handful of charts that I have focused on. Charts that come down to support and then refuse to break. We have discussed a few of them but let’s check in again.
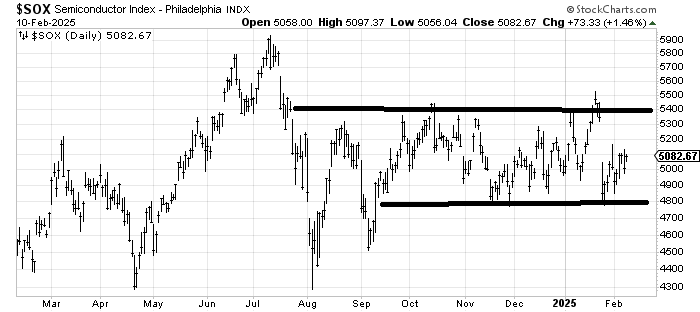
First there is the SOX. It has been in a wide range for nearly six months now. It tried to break in January and couldn’t. Now it sits in the middle of the range. I would respect a break in either direction but so far, the semis are unable to do it.
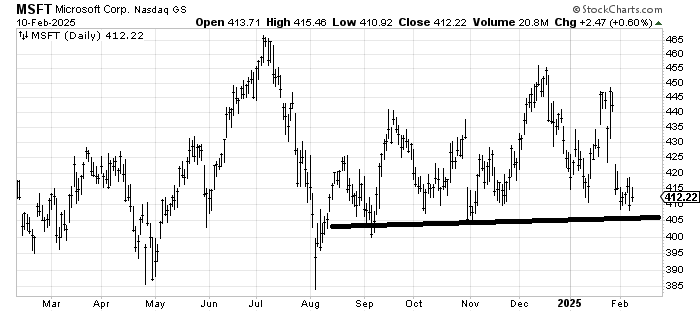
Then there is Microsoft. For the last six months, it has held this 405 area every time it has visited it. Is it the most important of the Mag 7? I have no idea but I do know that, similar to the SOX, I view this six-month support area as important.
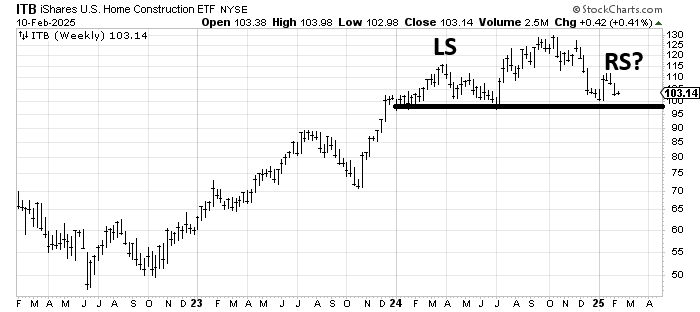
We have looked at the Homies before, but never with such a long-term chart. This is the three-year weekly chart of ITB. It has been working on a head-and-shoulders top for a year now. Here, too, we have to watch to see if this pattern completes or if it gets saved. It’s always more important when a weekly chart breaks than when a daily one does.
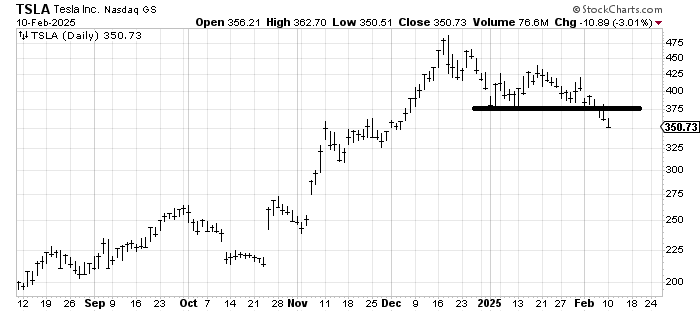
Finally, there is Tesla. This chart kept toying with that 375 area and could not break. It even tried to do so on Thursday and rallied right back to 375. But now it has broken. As you can see, breaking this is not as important as the SOX and MSFT or ITB but it is a fan favorite that has finally broken.
There aren’t that many charts with such obvious levels but these four are on my list to watch. I suspect chart watchers have these on their watch lists.
Aside from that, not much changed during Monday’s rally. It’s almost as if the chop time frame is getting smaller as we saw the S&P in what was essentially a ten point trading range not long after the market opened. We sat there all day.
Speaking of the chop, it’s taken a while, but on Monday, I began to see folks talking about the incessant chop in the market as if they had discovered gold in them thar hills! That probably means we’re about to leave the chop behind.
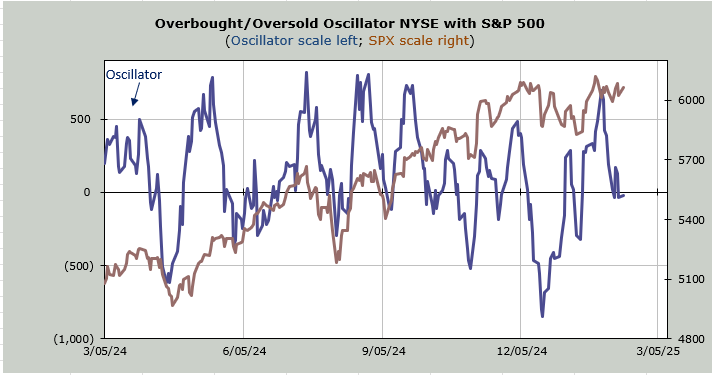
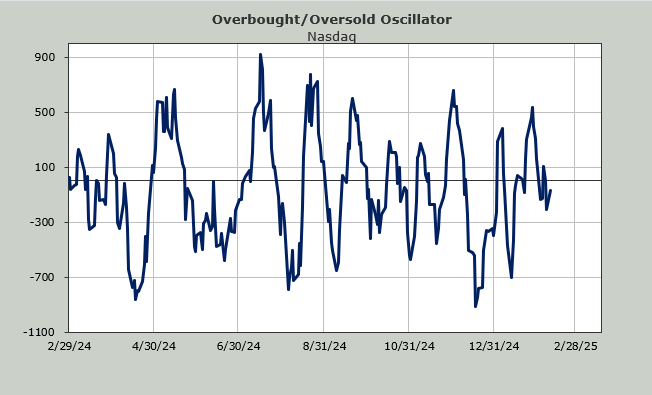
I wish I had a strong view on which way we’d break out but the indicators are so mixed it’s hard to take a stand. The Oscillator is no longer overbought; it sits at the zero line. And, part of the chop has brought us negative breadth six of the last ten trading days.
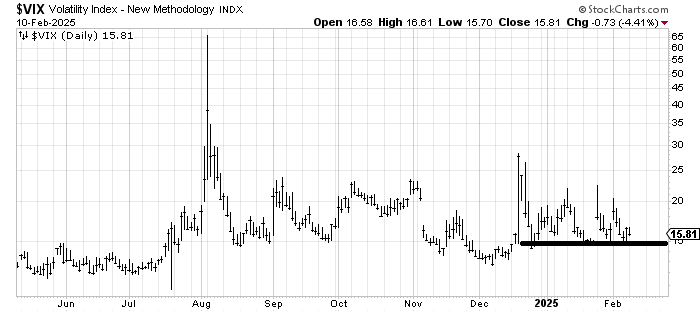
Yet the intermediate-term indicators are overbought (thus my call for a chop a few weeks ago). So, we’re sitting here wondering if we honor ‘never short a dull market’ or if we honor the fact that the VIX has stopped making new lows. For me that’s like picking red or black—it would be just a guess.
Maybe one of those charts above will give us some clarity soon.