Four Green Days, Still No Conviction: What Traders Are (and Aren’t) Buying
The rally has been steady, but sentiment says investors aren’t embracing it yet. Put/call data and a rebounding oscillator suggest “toe-dipping,” not a full-risk return.
You've reached your free article limit
You've read 0 of 1 free Pro articles.
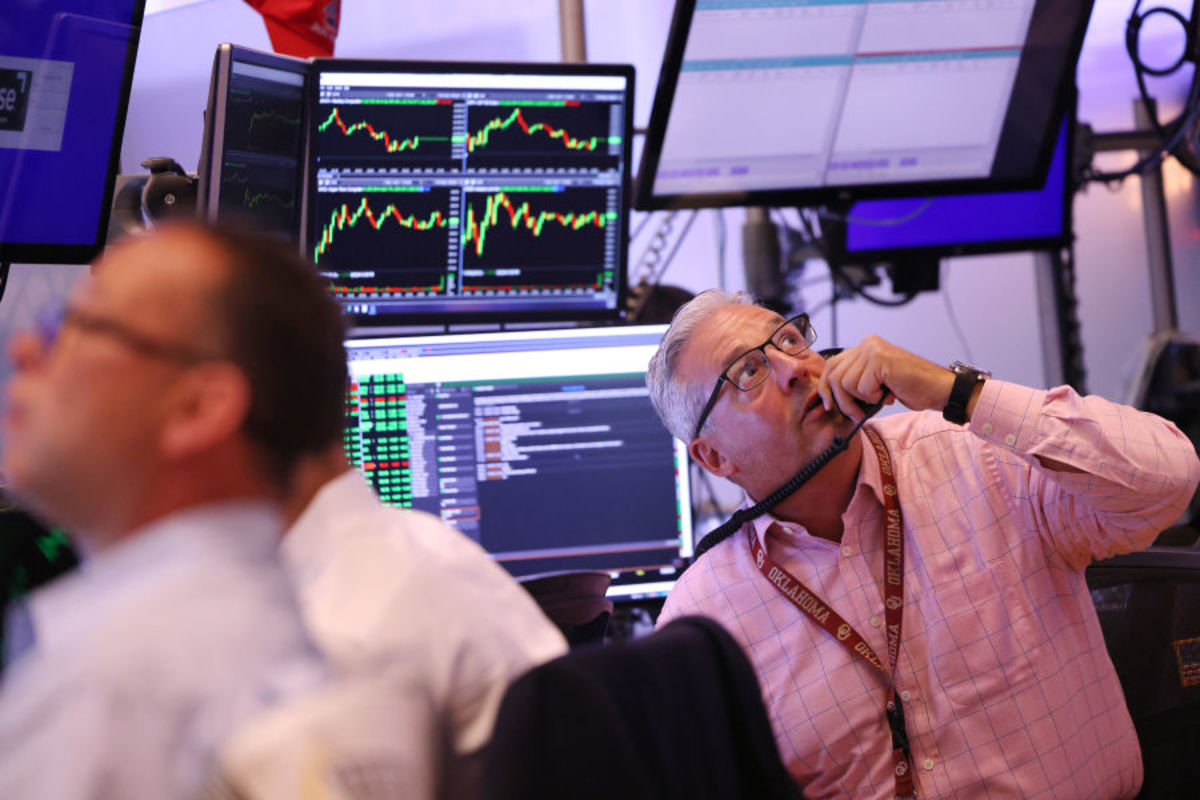 NYSE traders
Sure, we’ve had upside since last Tuesday’s big up day, but it has been a bit of a struggle in my view. Sure, it’s been four straight days of green, something we haven’t seen in months, but it still feels more like shuffling around than it does serious buying.
When you get real panic, you can get furious buying on the rebound. But when the market sort of limps to a low, I think it leaves folks feeling like, ‘should I stay or should I go?’.
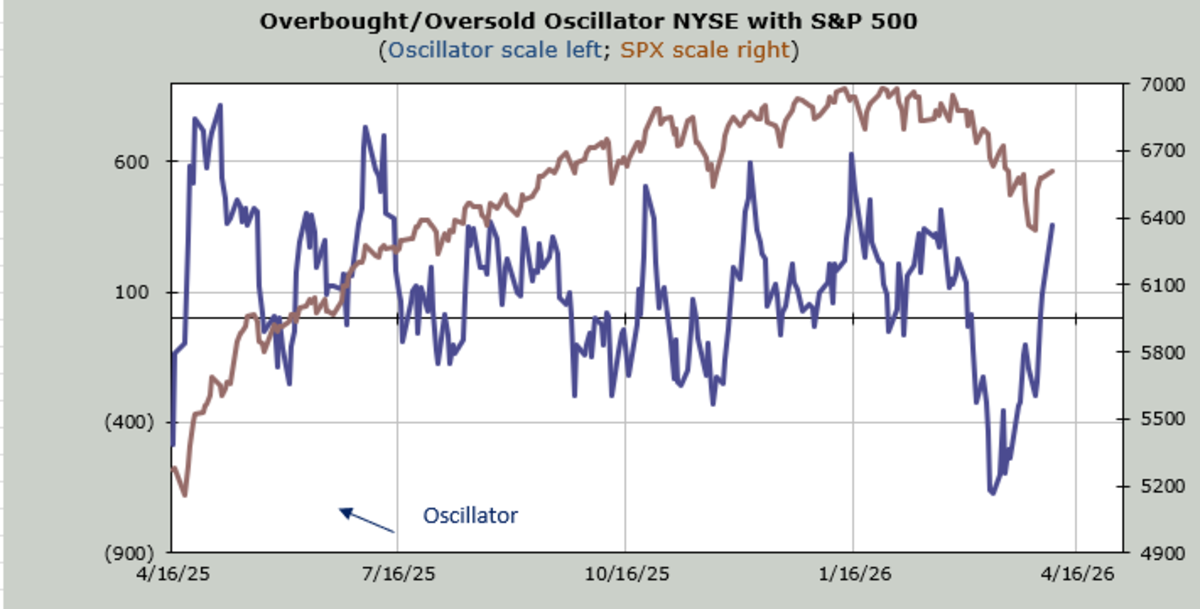
Let’s begin with the Overbought/Oversold Oscillator. We came into last week short-term oversold, and the market was well hedged. Some might even say very well hedged, as the put/call ratios had seen their moving averages rise up to levels not seen since April 2025 and, in some cases, even higher.
As the market rallied last week, those put/call ratios did not fall much, which surprised me. For example, of the four trading days last week, three of them saw the total put/call ratio over 1.0.
The ISEE call/put ratio stayed under 1.0 for most of last week as well. So, we did not see a quick embrace of the rally. On Monday, the fourth day of green, we saw the CBOE’s put/call ratio slip slightly under 1.0 and the ISEE push up over 1.0. I take that as folks are dipping a toe back into the water.
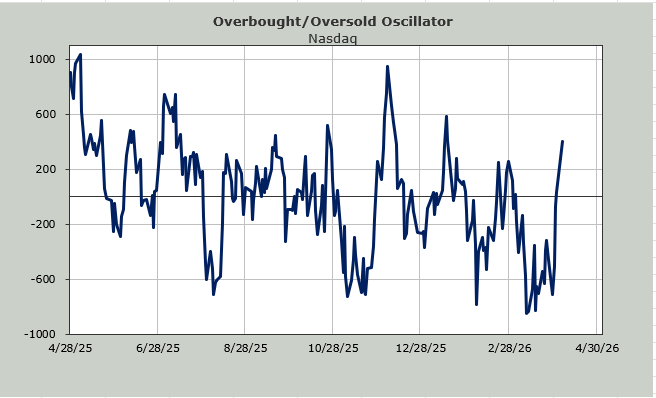
If you look at the Oscillator, you can see it appears to have soared. It has, because we were oversold. It ought to pull back for a few days and then have another attempt at the upside before we get back to an overbought condition.
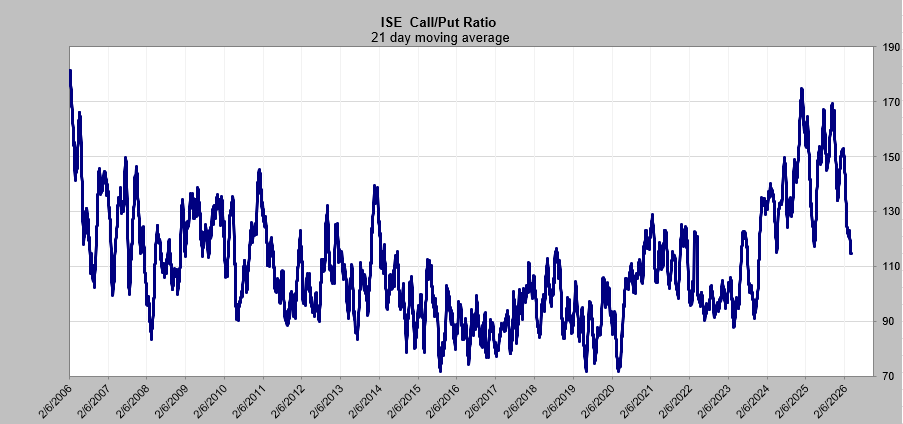
The aforementioned ISE call/put ratio’s 21-day moving average is now a smidge under the April 2025 level, so we can see the lack of call buying in this chart. My only question—and I wish I knew the answer—is if it is going into a new range, or will it stop here and head upward.
There is always a question if the market has moved from a bull to a bear market (and vice versa), and I think if this falls under 1.10, I would consider it a change.
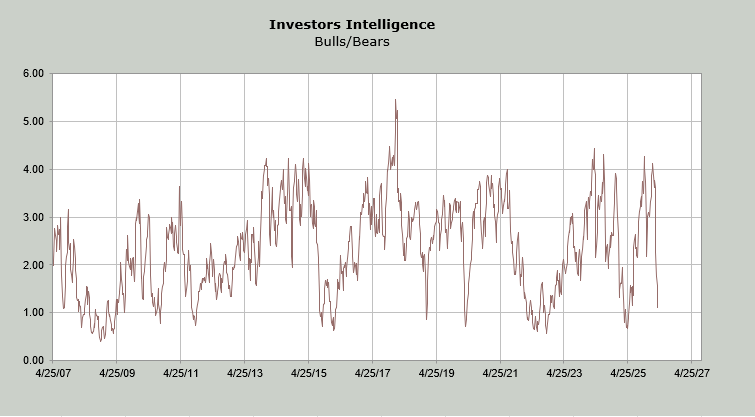
Then there is the Investors’ Intelligence survey, which saw a decent decline in bullishness. Recall it was at 63% bulls in early February and is now at 35% bulls.
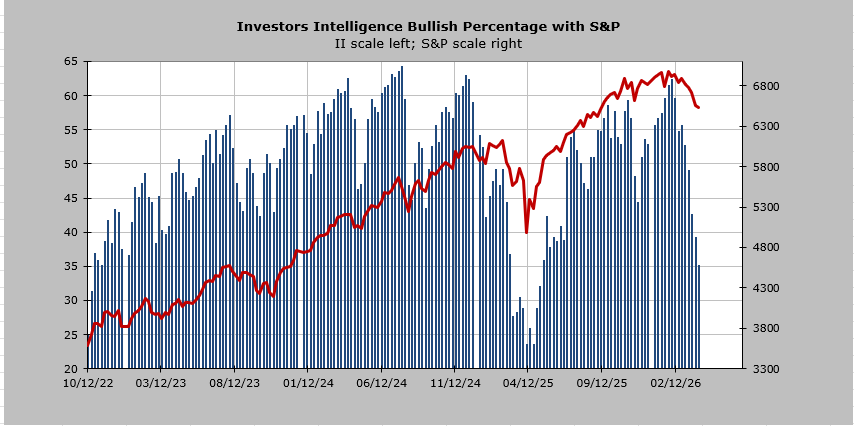
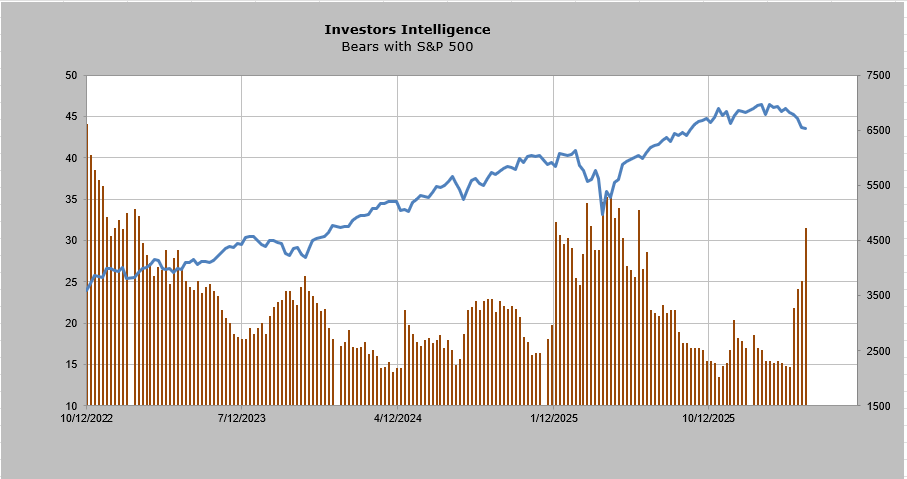
The bears have doubled since early March and now stand at 31%. So, there are not more bears than bulls, but we have seen a significant shift in sentiment.
The bull/bear ratio is now at 1.1. Recall in February, it got extreme at 4.2. I always prefer to see this under 1.0 (more bears than bulls), but so much about last week’s low felt insufficient as I noted above.
This remains a news-driven market that, in my view, got oversold with too much hedging, so we’ll have to see if/when folks warm back up to the market as we get back to an overbought condition.