Everyone Was Bullish in January—So Why Are Fear Indicators Spiking Now?
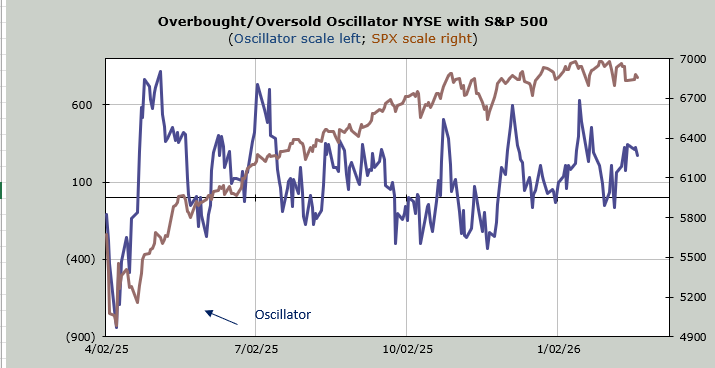
Despite steady breadth and no major breakdowns in the S&P or QQQs, investors are pulling in their horns. The data suggests a deeper anxiety is brewing beneath the surface.
You've reached your free article limit
You've read 0 of 1 free Pro articles.
Okay, the S&P is flat on the year, the market has pretty much done nothing all week, and still, I am going to discuss sentiment because it seems to be the only indicator(s) that has moved this week.
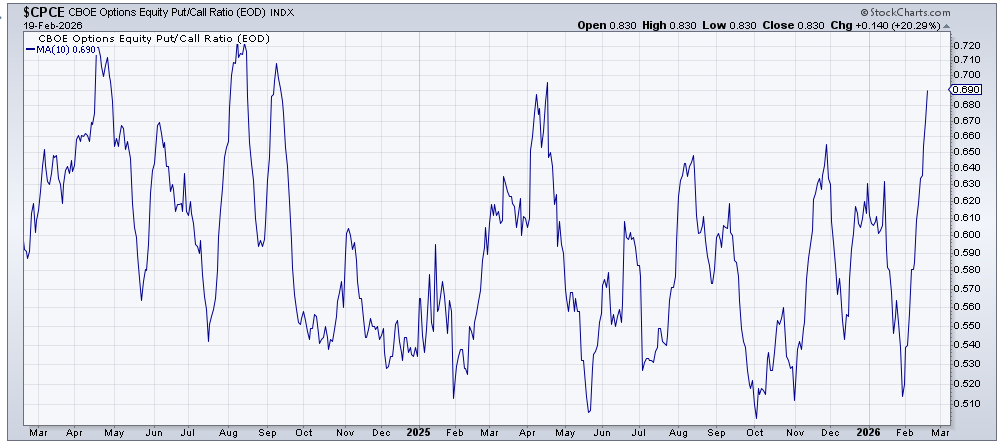
Something is definitely underfoot when it comes to the options markets. Yesterday I noted that the total put/call ratio’s ten-day moving average was a bit higher than it was at the November low (the S&P was 6500 then). Today, I am here to report that the equity put/call ratio not only surpassed its November reading but is now closing in on the April reading from last year. You know, when the market collapsed on the Tariff Tantrum.
It’s not yet up where it was in 2024 when the S&P fell nearly ten percent over the course of a few months, but for a market that saw everyone come into the year with bullish leanings and much higher S&P targets, this is a big change of heart. Especially when you consider the S&P has barely moved.
I mean, I could understand if we broke 6800 (we obviously haven’t because I am waiting on the edge of my chair for that). Yet that is not the case. I could understand if the QQQs had broken that 580-ish area that everyone has their eyes on. But they haven’t done that either.
I might even understand if it was because breadth had been garbage, but that hasn’t occurred either. Nope, I think this is because beloved tech/growth stocks have rolled over this year, which is obviously not what folks were expecting.
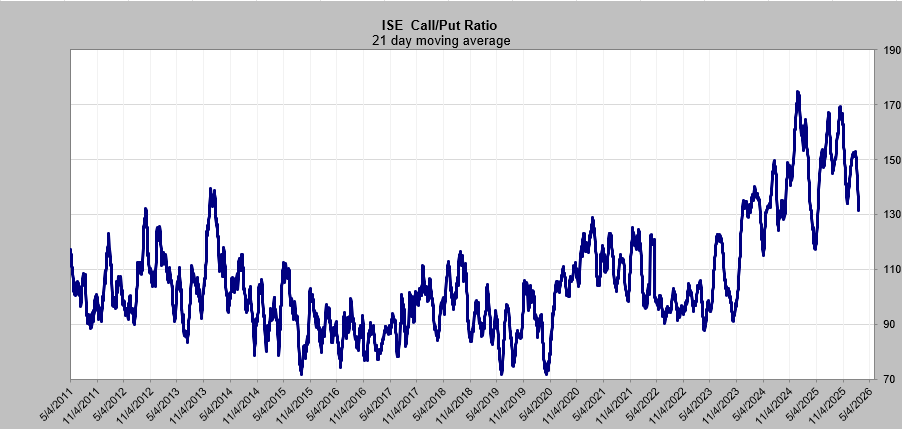
We have been looking at the ISE call/put ratio and the shorter-term moving average lines, which have broken the prior (November) lows, but now we have the 21-day moving average that has broken the November low. A 21-day moving average shows a lot more persistence than a ten-day moving average.
There is still a lot of room to go for this to get to the April low around 1.15 (it is currently 1.31), but again, you can see the change in sentiment.
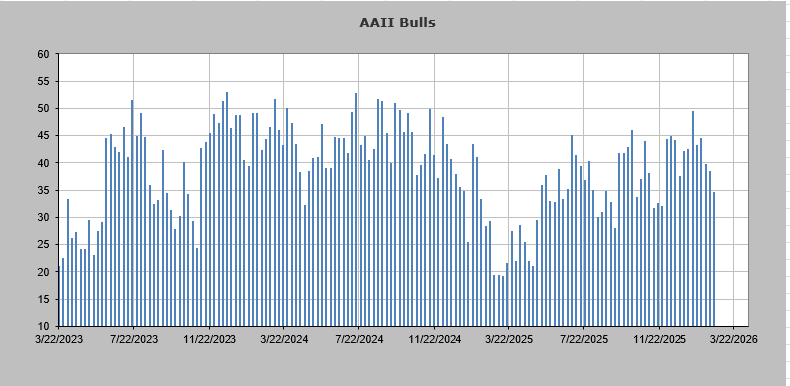
The day traders at the American Association of Individual Investors (AAII) have pulled in their horns as well. Six weeks ago—entering the new year—the bulls got to 49%. Now they are at 34%. That’s not as low as they were in November (28%), but again, that is quite a change in sentiment for a market that has gone nowhere.
From just a sentiment perspective, you can see why I think a break of 6800 on the S&P would get us to hysteria in a hurry. Yet my patience is wearing thin as the market continues to save itself every time it gets down there.
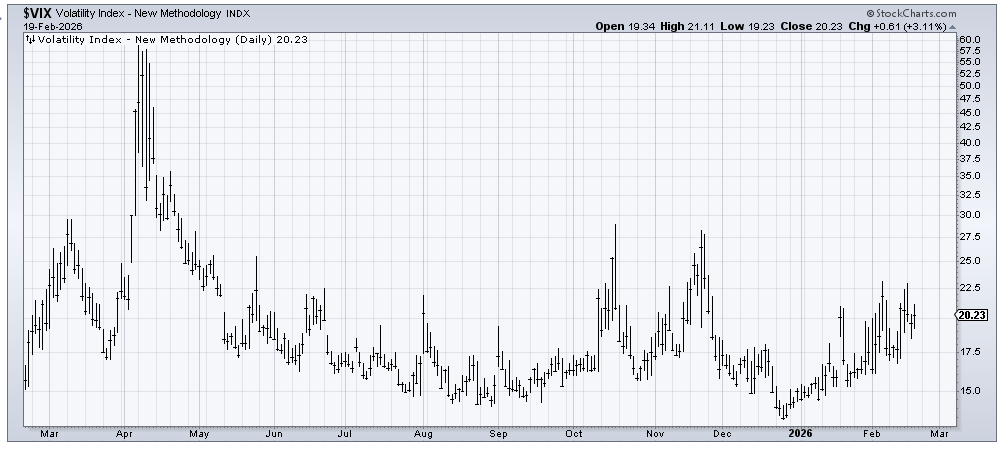
Heck, look at the VIX, which entered the year at 15 and now resides at 20. You just know a break of 6800 would get this jumpy; it’s sitting on the edge.