The Energy Sector Sends a Strong Message About U.S. Involvement in Iran
Crude oil, Exxon Mobil, and Chevron are giving investors clear insight into the next phase of this conflict.
You've reached your free article limit
You've read 0 of 1 free Pro articles.
Think you’ve seen it all? In this market, you’ve never seen it all.
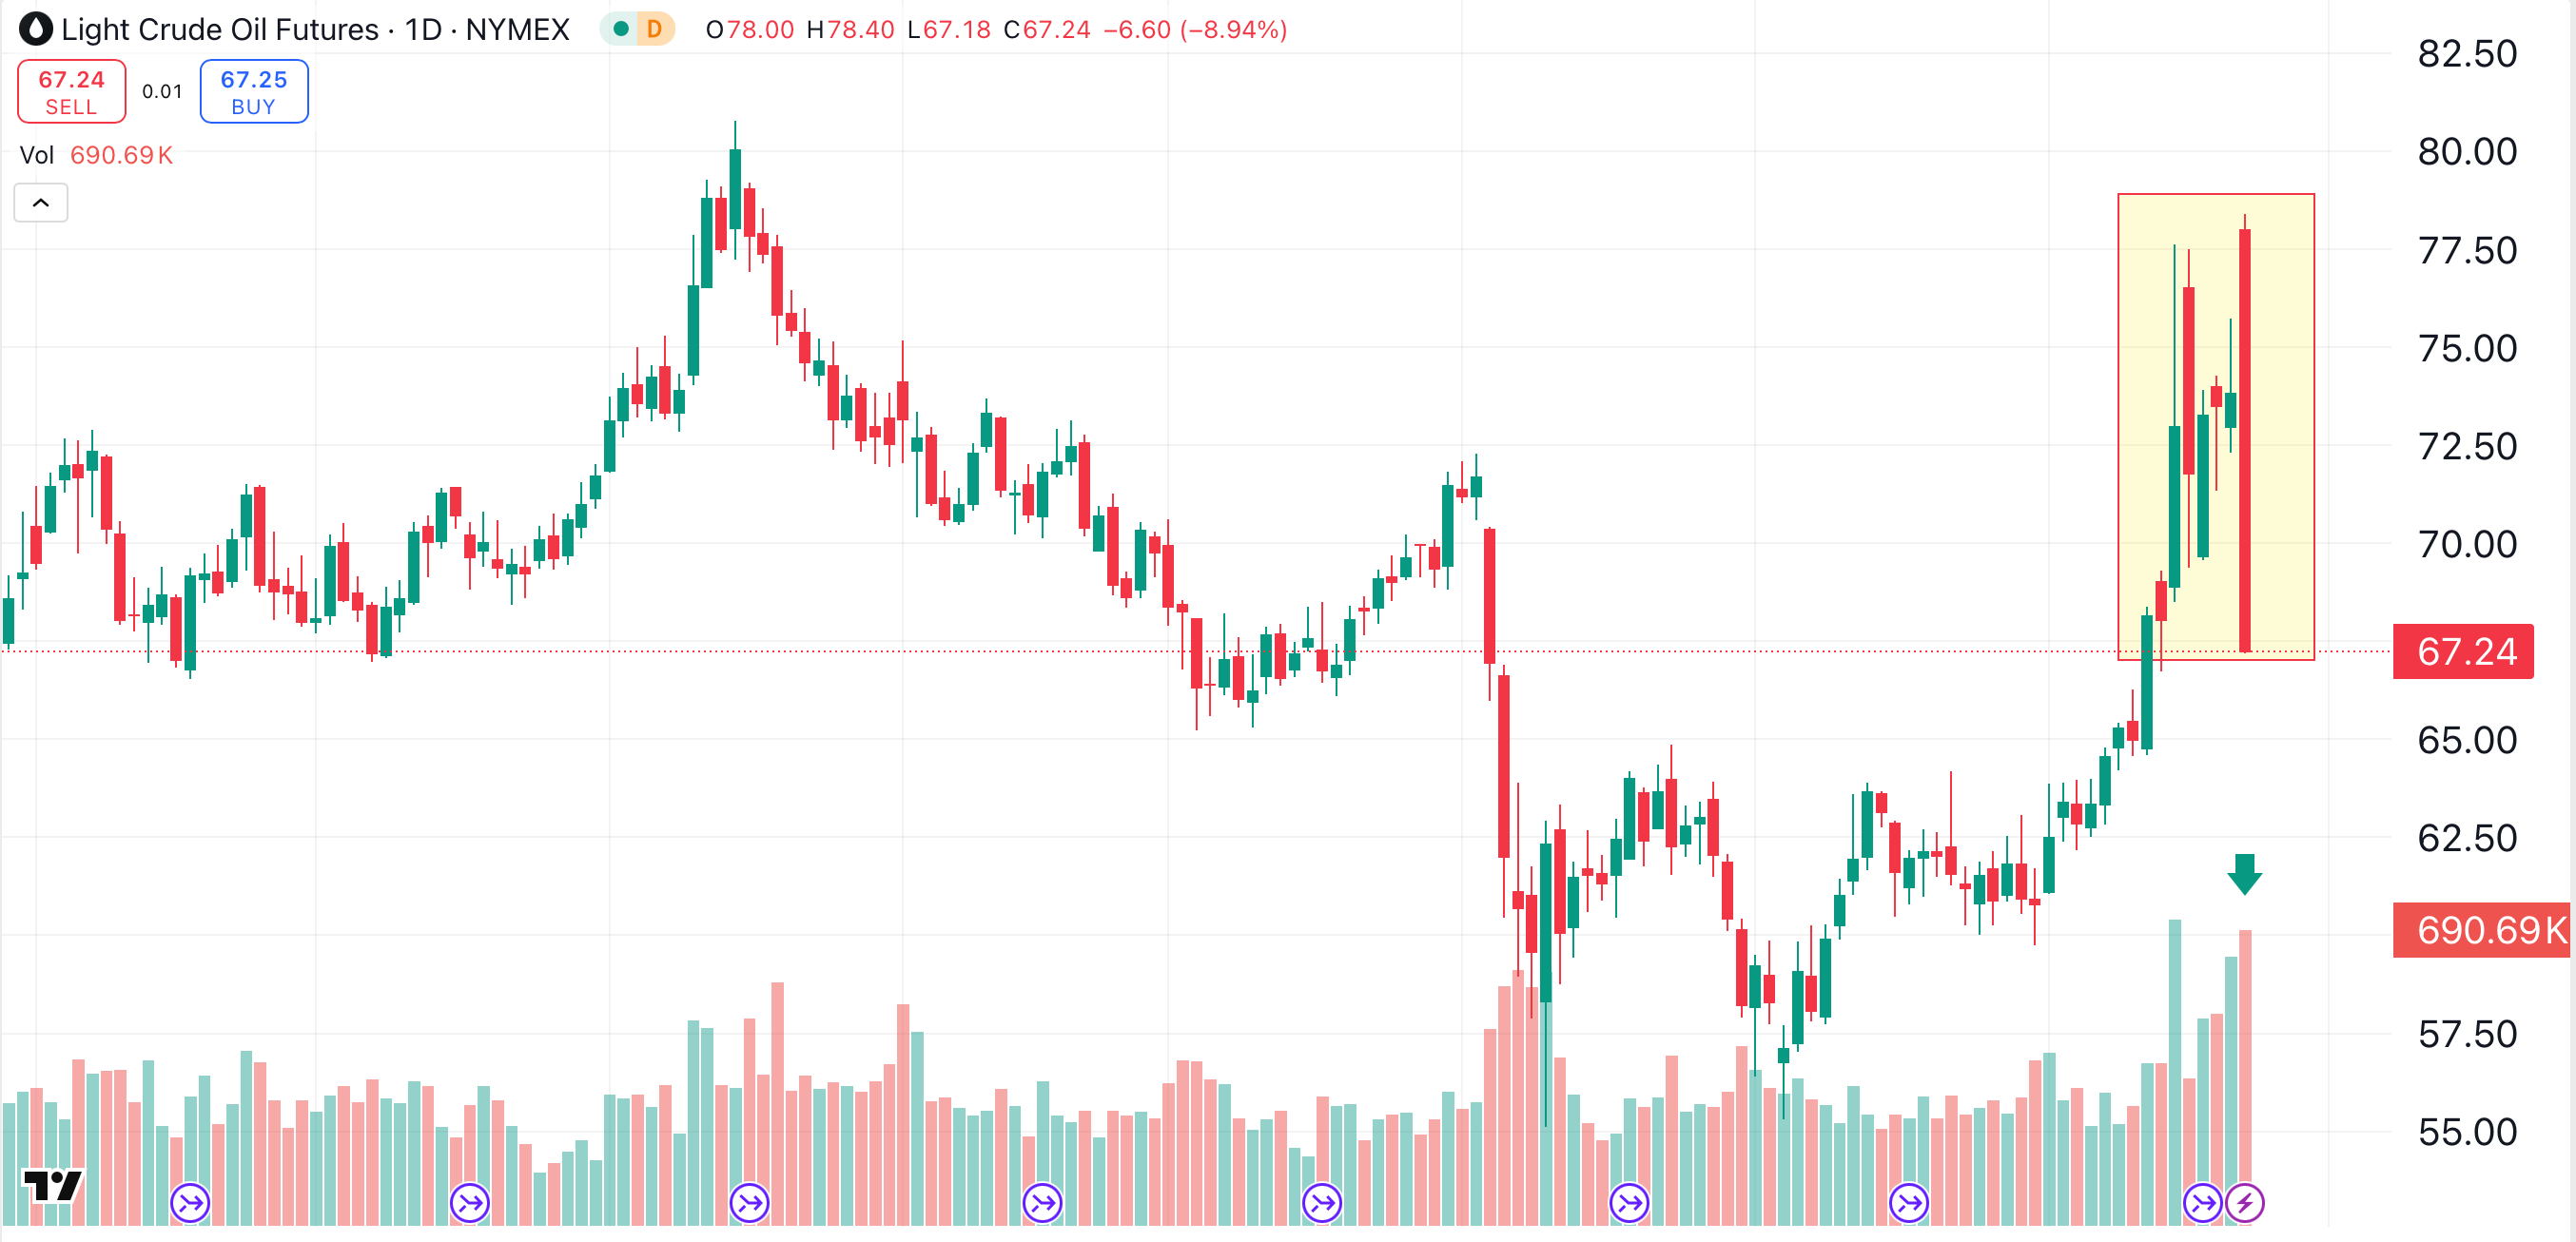
Case in point — on Sunday evening, West Texas Intermediate crude oil gapped higher to climb above $78 per barrel. By Monday afternoon, WTI crude traded below $68. Energy markets breathed a sigh of relief as Iran’s missle attack on a U.S. base in Qatar turned out to be largely symbolic in nature.
Admittedly, this wasn’t as bizarre as the time when crude oil futures dropped well below $0, back in the early days of the pandemic. Still, technical traders stood up and took notice.
Crude Oil Reversal
Monday’s price action in WTI created a huge bearish engulfing candle. This massive candlestick reversal pattern (shaded yellow) engulfed an entire week’s worth of activity in the crude oil market, wrecking the trades of anyone who was holding a long position that was initiated at any point last week. The reversal occurred on heavy volume (green arrow), which tells us that any bounce against Monday's move is likely to be short-lived.
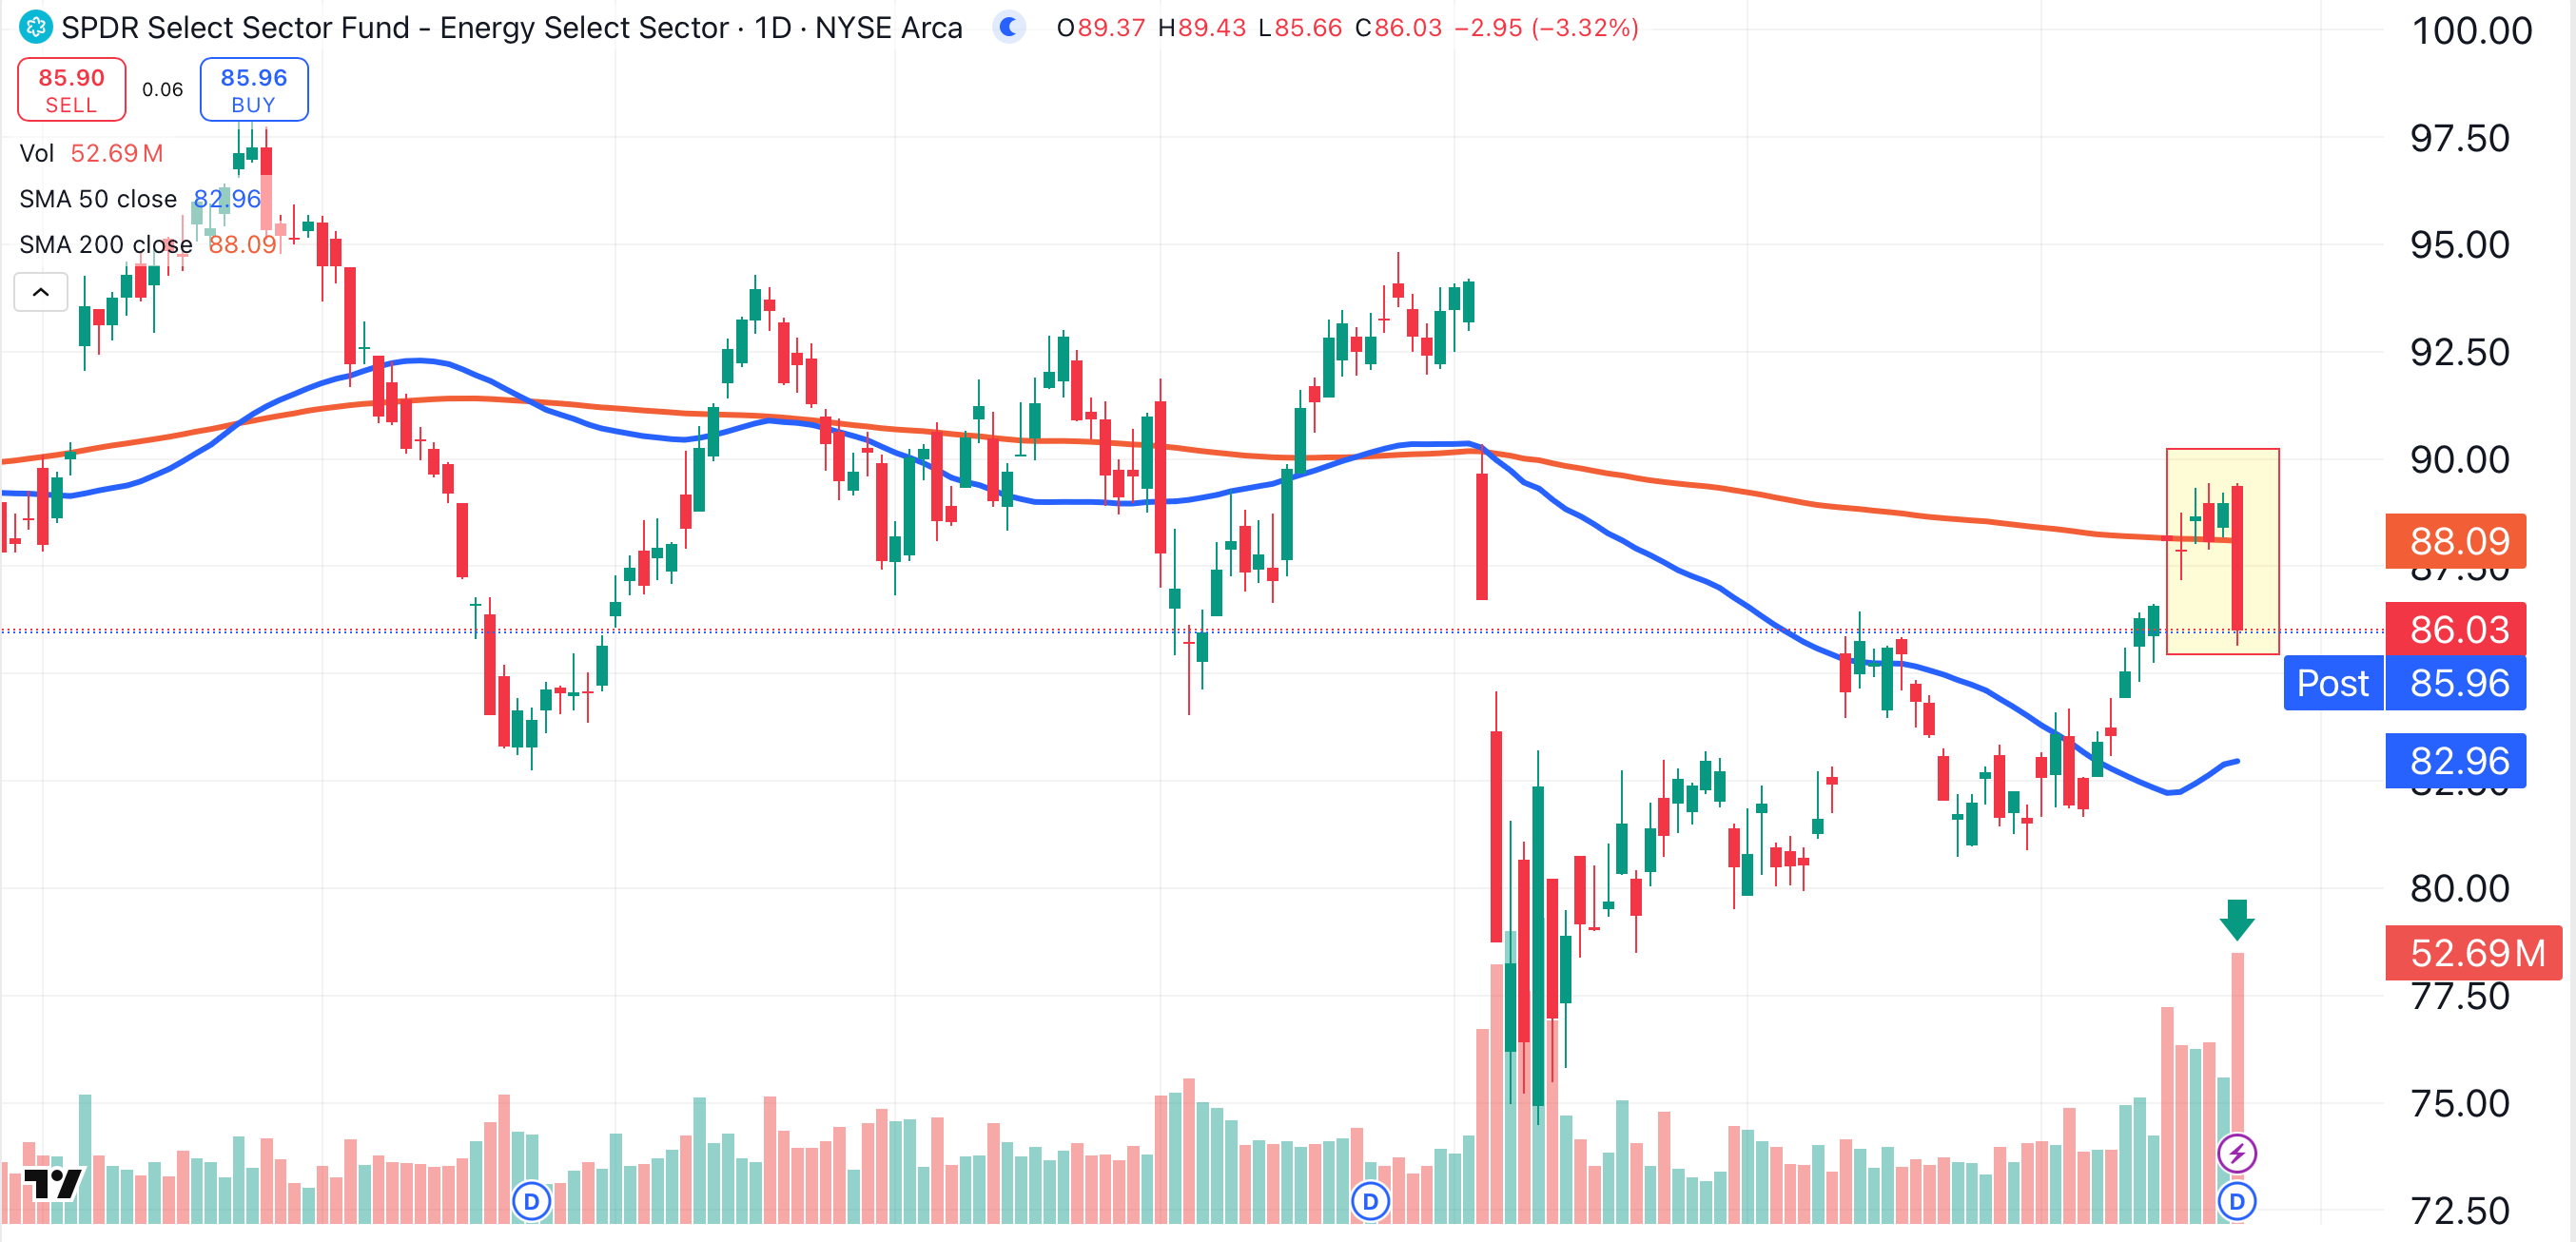
That same pattern is visible in the SPDR Energy Sector ETF XLE. This bellwether for the industry has also formed a large bearish engulfing candle (shaded yellow). XLE fell below its 200-day moving average (red) on its highest volume in months (green arrow).
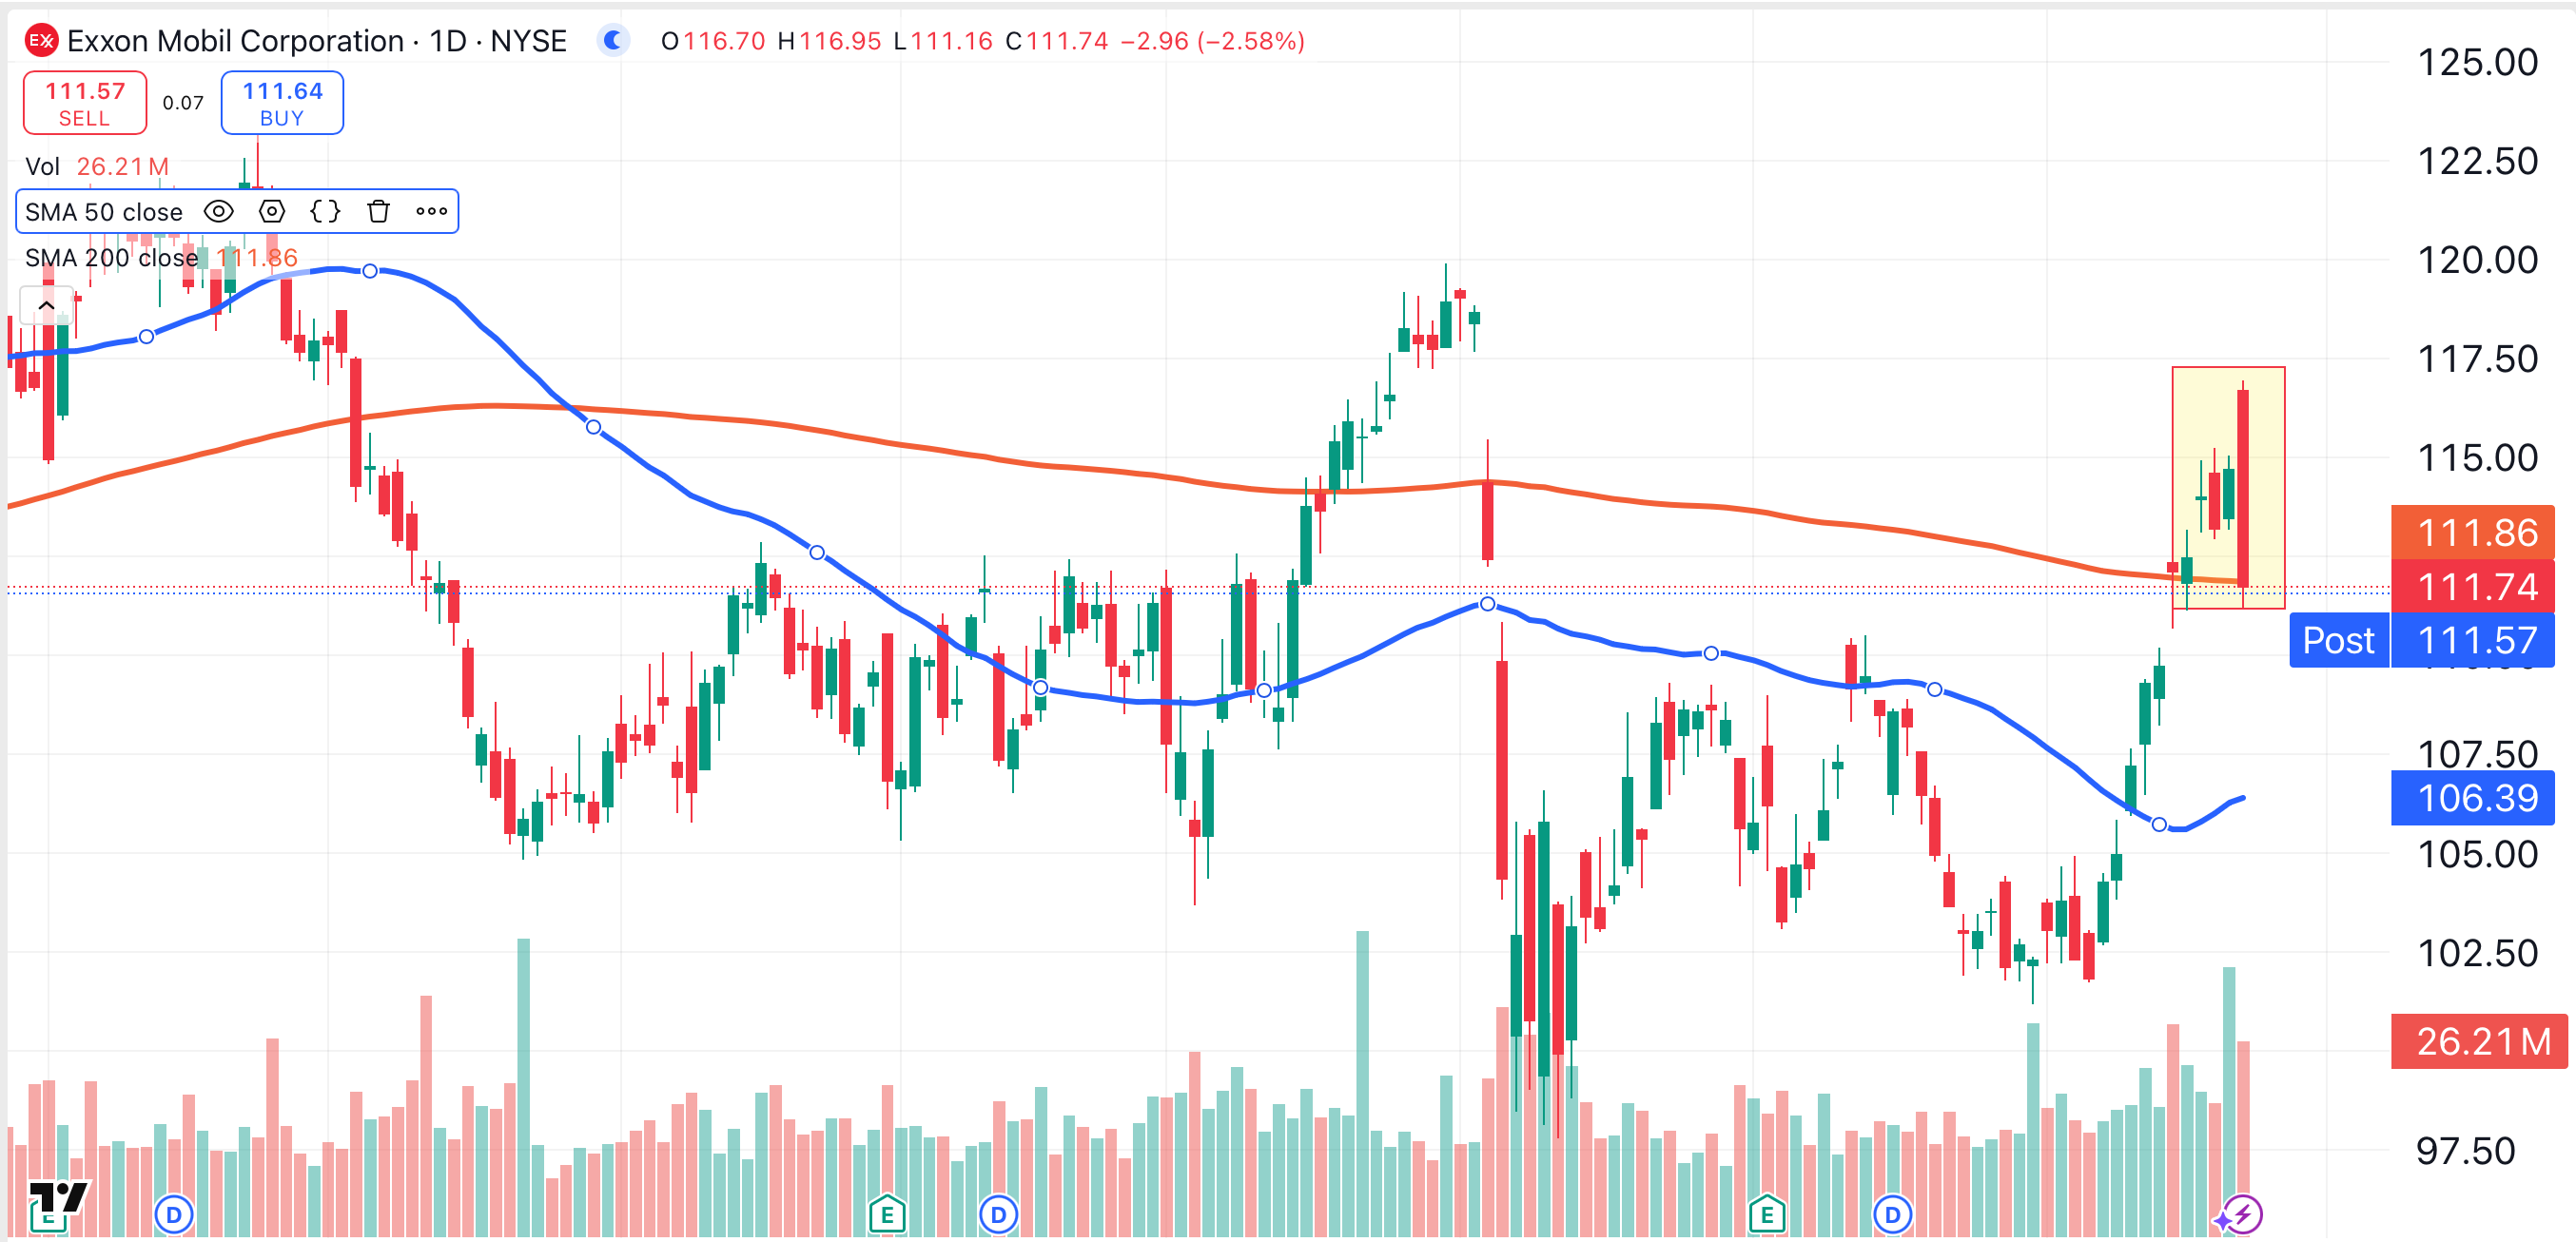
A massive bearish engulfing pattern can also be seen on the chart of Exxon Mobil Corp. XOM. Shares of the Houston, Texas-based oil and gas multinational fell 2.5% in a bullish market on Monday. Interestingly, Exxon Mobil found support directly on its 200-day moving average on Monday (red), as the stock closed within pennies of that key indicator.
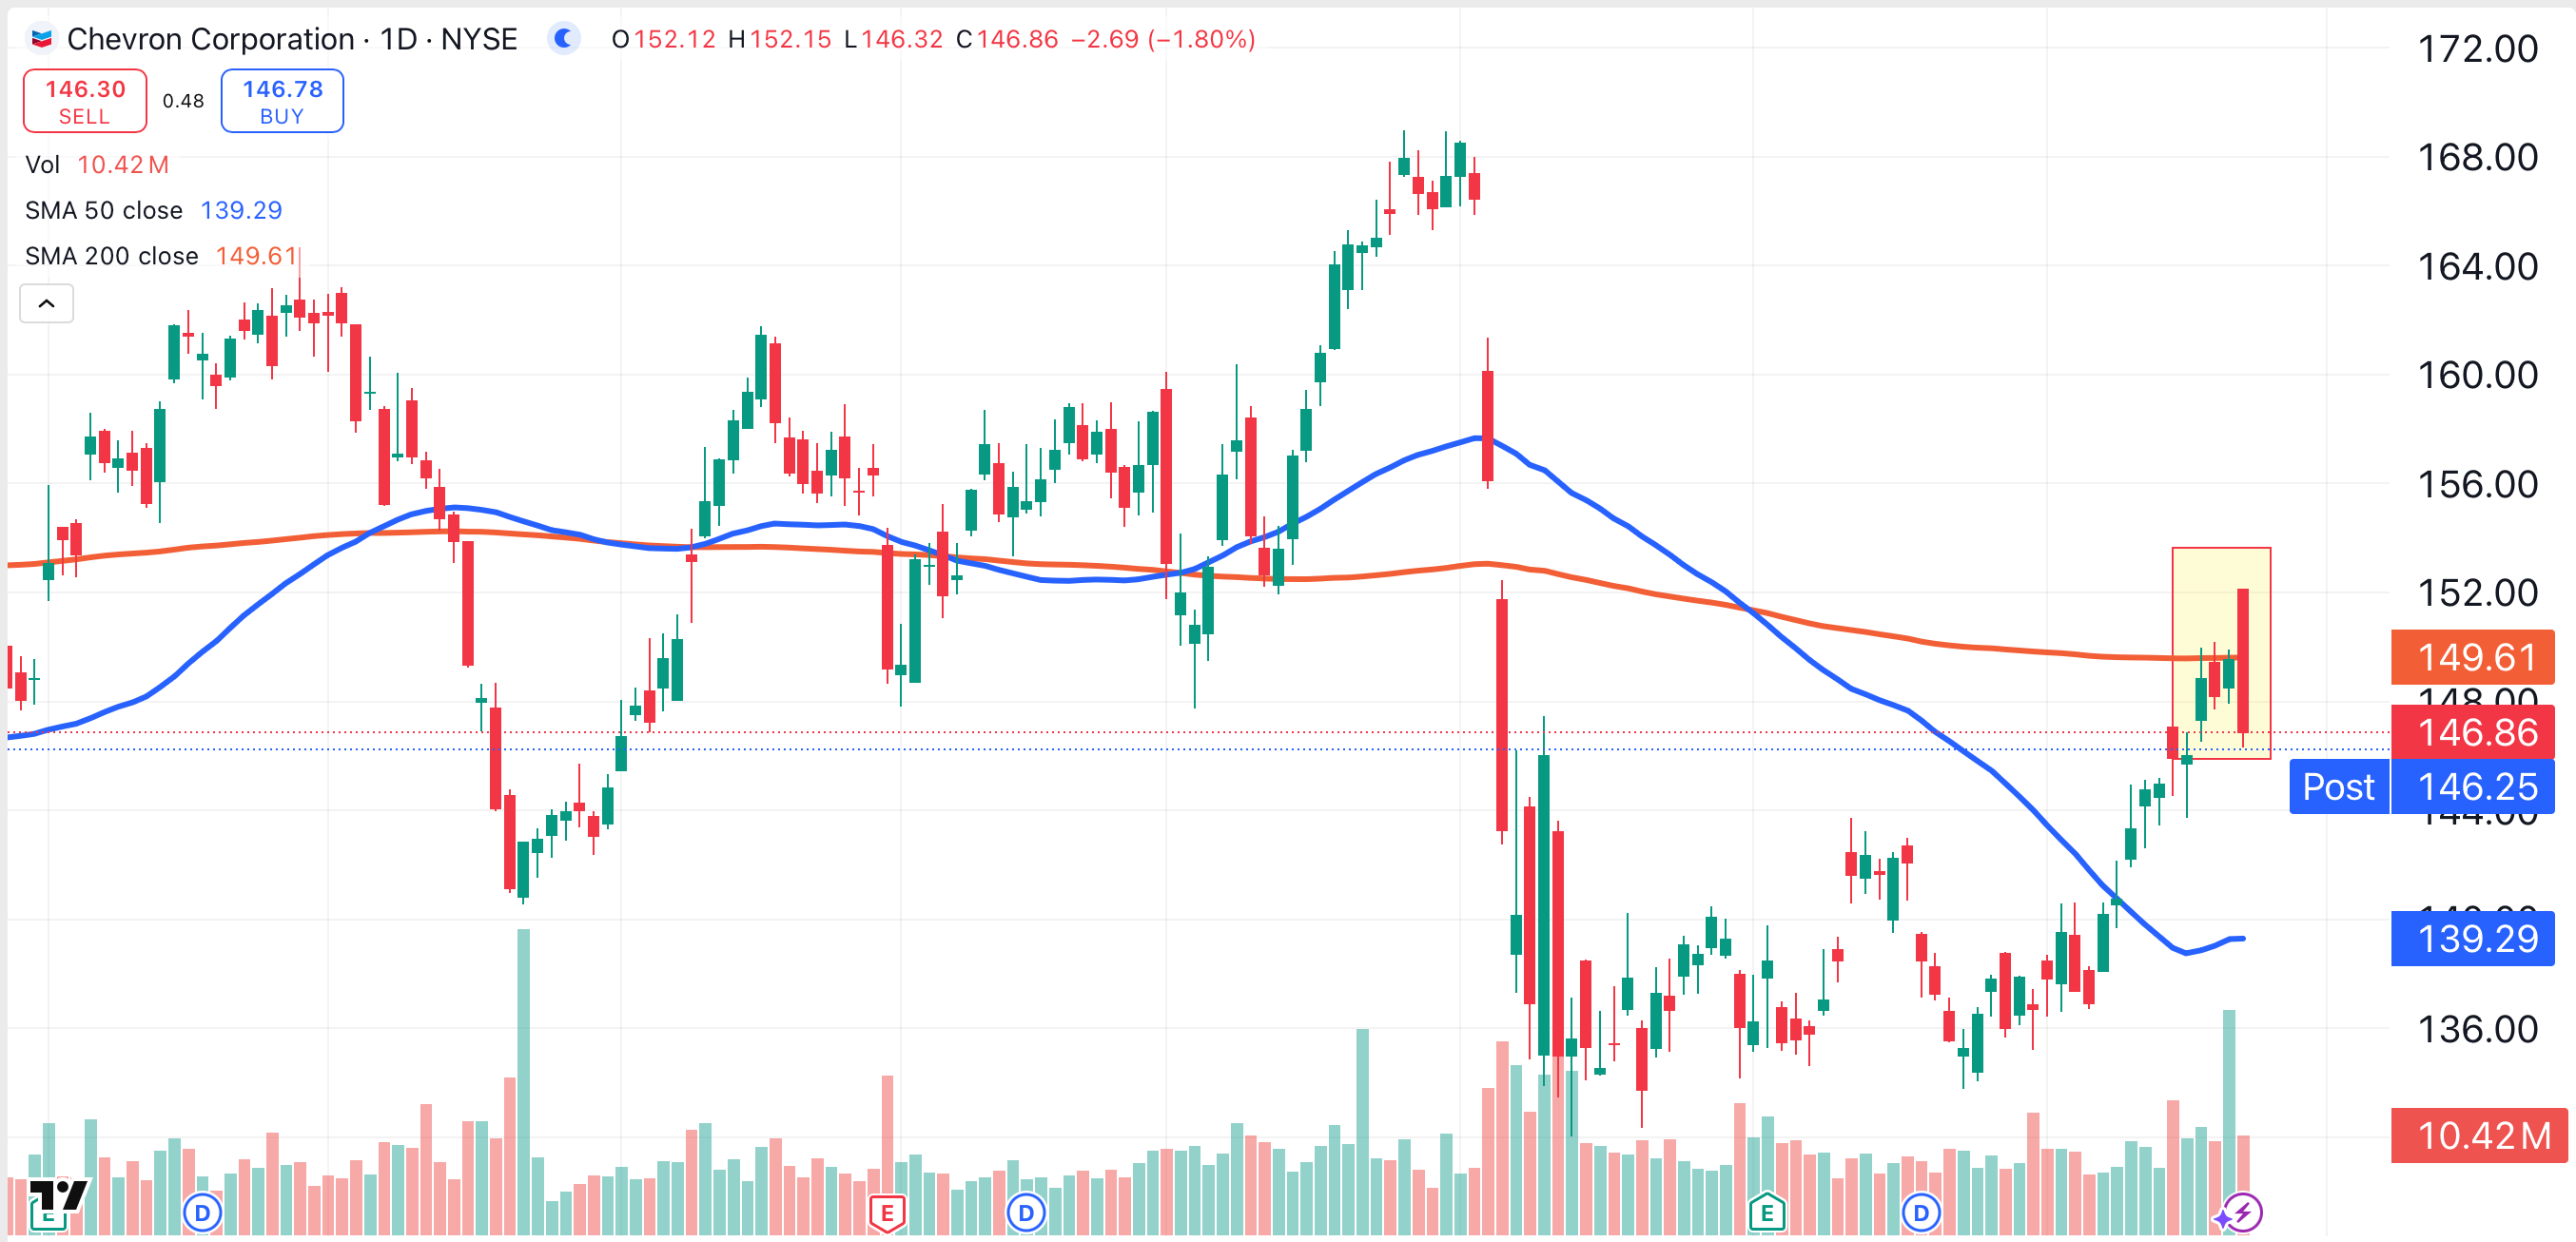
Chevron Corp. CVX fell by 1.8% on Monday, while forming the same bearish candlestick pattern (shaded yellow). Unlike Exxon Mobil, Chevron failed to hold above its 200-day moving average.
Time for a Reality Check
None of the above charts had any potential prior to the recent flareup of Middle East hostilities. They were all in bearish trends, failing to make higher highs, despite participating in a bullish market that is approaching all-time highs.
What is the takeaway from the massive bearish patterns on WTI crude, Exxon Mobil, and Chevron? The U.S. isn’t likely to enter a full-fledged war with Iran. In fact, it’s likely that this weekend’s bombing of Iranian nuclear facilities was the peak, rather than the start, of U.S. involvement in the Iran-Israel conflict.
There were predictions that travel through the Strait of Hormuz, vital to the world’s global oil supply, would be restricted, driving WTI crude oil to $100 per barrel or higher.
The charts are telling us that isn’t going to happen. The Strait will remain open.
The Bottom Line
Here's the bottom line: If you’re betting on crude oil or energy stocks to rally on violence and warfare in the Middle East, the charts are telling you — very loudly — that you're on the wrong side of that trade.
