End-of-Quarter Pop… or a Hedge Unwind? Options Data Points to Both
A crowded hedge trade can fuel sharp upside when it unwinds—but the lack of a positioning reset suggests the next downtick could bring hedging back into focus fast.
You've reached your free article limit
You've read 0 of 1 free Pro articles.
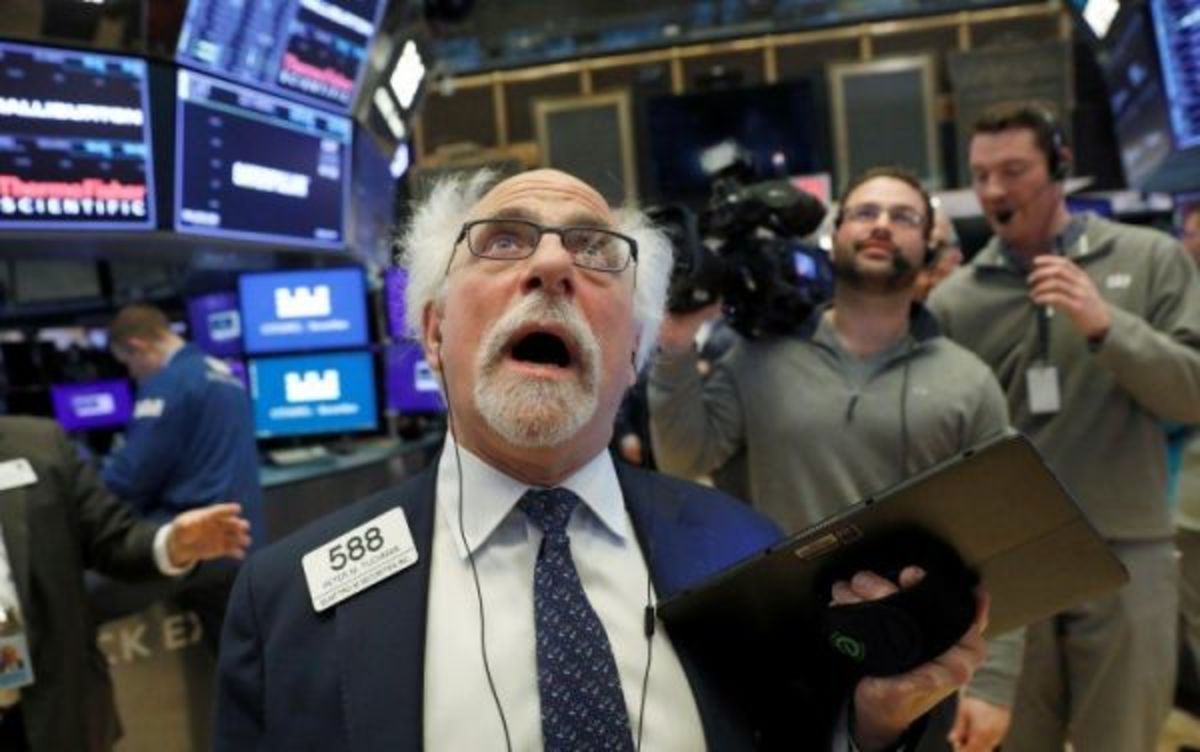 NYSE Traders
Note: I am taking a few days off to visit my mother for Passover. Wishing you a Happy Passover/Happy Easter! My next column will be on Monday evening, April 6th.
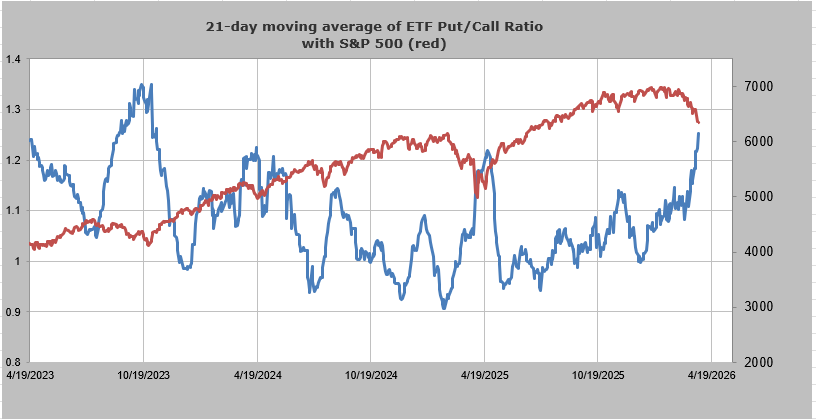
Was that end of the quarter action, or just end of the quarter action helped along with the unwinding of all those hedges? As we have discussed, folks were pretty hedged up. Just look at the 21-day moving average of the put/call ratio for ETFs: it is now higher than it was in April 2025.
I would have thought we’d see the put/call ratio back off after a day like Tuesday, but that was not to be. The CBOE’s total put/call ratio stayed elevated at .98. What’s more, the ISEE call/put ratio finally fell under 1.0. This is noteworthy to me.
I have written about the ISEE (mostly retail trades) for months now because it had been showing us much lower readings than we’d seen in years. But there was never a ‘panicky’ reading under 1.0. Tuesday, the day of the big rally, finally saw such a reading.
The last time it fell under .90 was on April 4, 2025. It was, as it typically is, on a down day (arrow on the chart). As you can see, we had a couple of more days on the downside, and that was it. So it is unusual to see it this low on such a big up day.
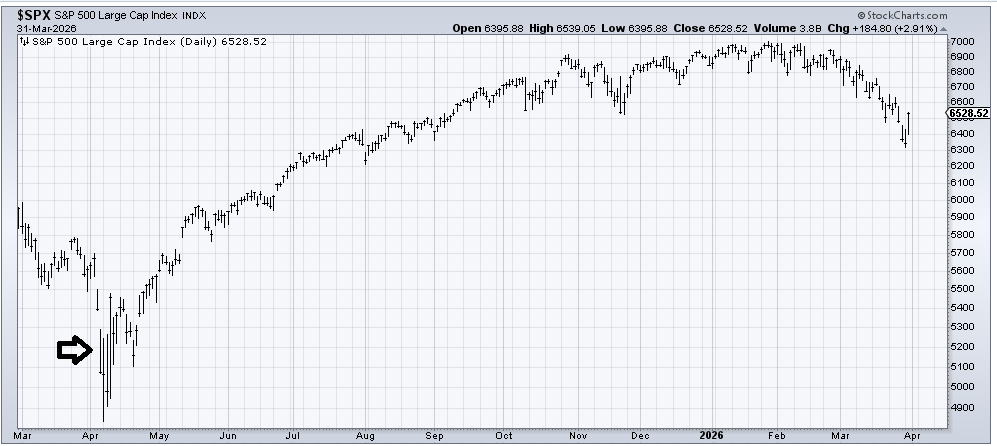
The last time we saw it this low on a big up day was in June of 2024, as we were coming off a low in late April and a minor low in late May. What I find interesting about this time frame is that the rally kept going for a few more weeks and then slid again. Recall last year, the secondary pullback was much more minor. In 2024, it was not minor.
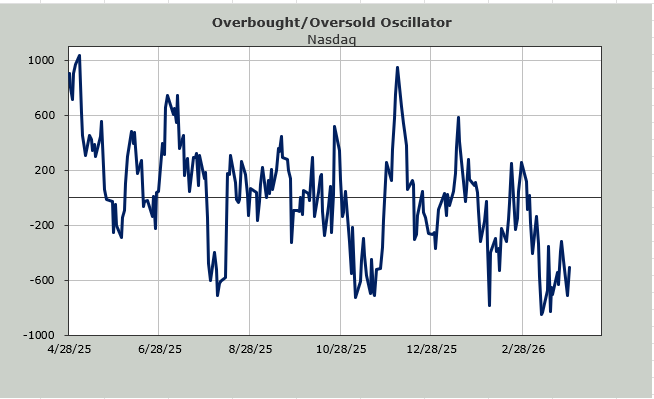
Away from that, the rally was concentrated in the big-cap/Nasdaq names. That is where we were most oversold (see the Nasdaq Momentum Indicator I showed here the last few days). It is also where the Hi-Lo Indicator got oversold when it got to .16.
The NYSE saw 77% of the volume on the upside, which is a pretty poor showing for such a big up day. It was actually better on March 23rd when the S&P tacked on only 74 points on the day.
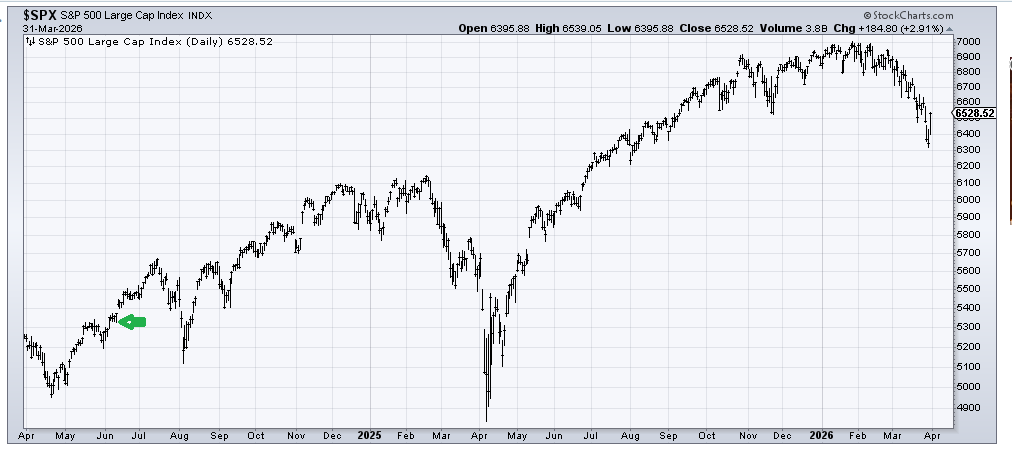
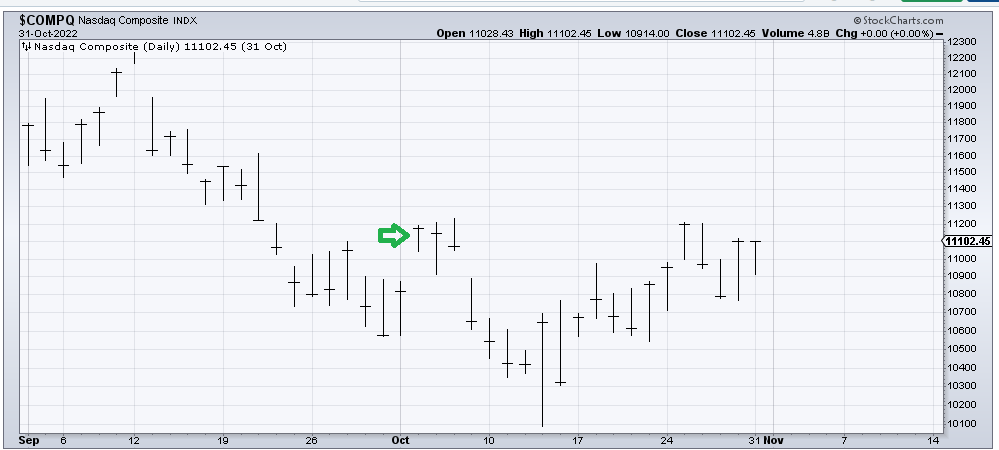
But once again, it was Nasdaq that saw the love as upside volume was 87%. The last time Nasdaq had this much volume on the upside was in October 2022. And curiously, it was after a decent slide that we had this big up day (green arrow). We hung around for another two days before we gave it all back. But we slid into a low, a good low.
I’m not sure we’ve seen the low. But I do know that we were quite oversold (still are) and folks were (probably still are) pretty hedged up. So, I have no strong view on the next few days, but I do think if we come down again, the Nasdaq Momentum Indicator will get back to an oversold reading, and unless sentiment changes drastically, we’ll probably still be all hedged up.
Related: Under Some Pressure, We're Looking to Take Advantage of This Rally
