Eight Up Days in a Row. Can We Go for Nine?
But the real question is, when will momentum be overbought?
You've reached your free article limit
You've read 0 of 1 free Pro articles.
That’s eight straight days of green for the S&P. Can it go to nine? Sure, why not? But one thing we all know is that these streaks come to an end, and the closer you get to double digits, the more likely it is that we get a down day.
But have you noticed something else? We were down on Wednesday but rallied back to close near the high of the day. On Thursday, we were up all day but sold off to close near the low of the day. That is precisely what I mean by chop. It’s as if no side can get much traction.
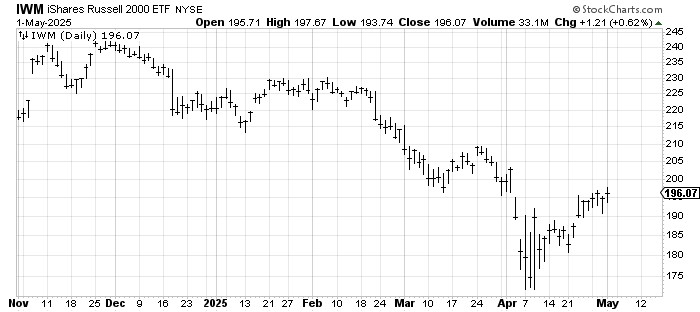
And aside from the big-cap tech stocks, most of the stocks that rallied last week have spent the majority of this week sitting there. Look at IWM, which has mostly spent the last week trading between 190 and 195-6.
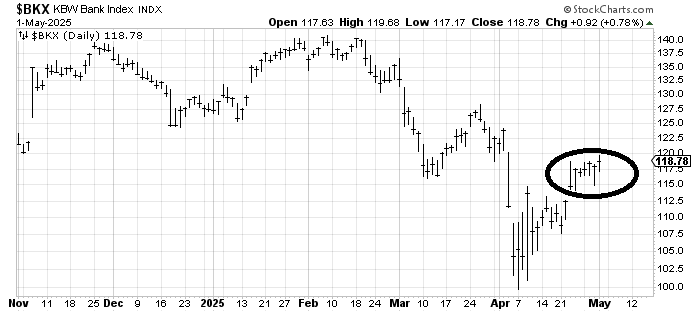
Even the banks. They were fabulous with their earnings, and then they have spent the last seven trading days churning around. This is how we eat through resistance. It’s a process. We all want it to be fast and be over and done with, but that’s not the reality.
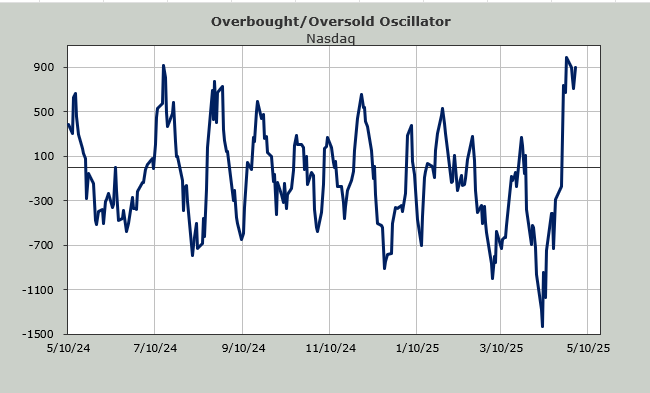
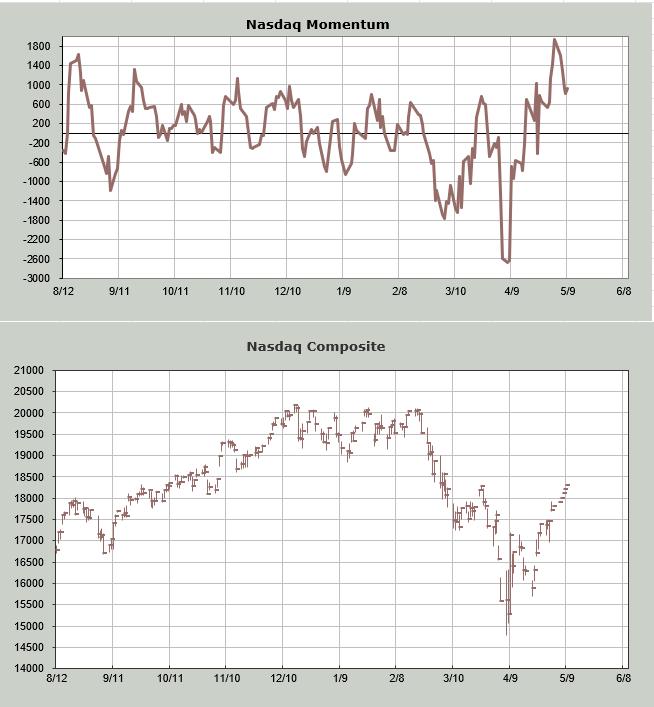
But let’s get back to Nasdaq. Nasdaq hasn’t had eight straight days of green. In fact, it had two red days this week. Yet a week ago, I showed you the Nasdaq Momentum Indicator. What I do here is attempt to find the point in time (approximately) that the index loses upside momentum. We did this same exercise at the lows, where I look for the point in time we lose downside momentum.
What I do is plug in higher closes for Nasdaq over the next several days. I’m looking for the point in time where a higher close in the index no longer gives us a higher close on the Momentum Index. A loss of momentum is the definition of overbought (or oversold). With Nasdaq that happens Friday.
I plugged in higher closes for the next several days, taking Nasdaq up to 18300 (it closed at 17710), and no matter what I do, the Momentum Indicator heads down next week. Again, this is not meant to find the exact day, but the general time horizon, and we’re there.
I do not think the market is set to fall apart. I still think it is too early for that. But some chop and pulling back seems likely.
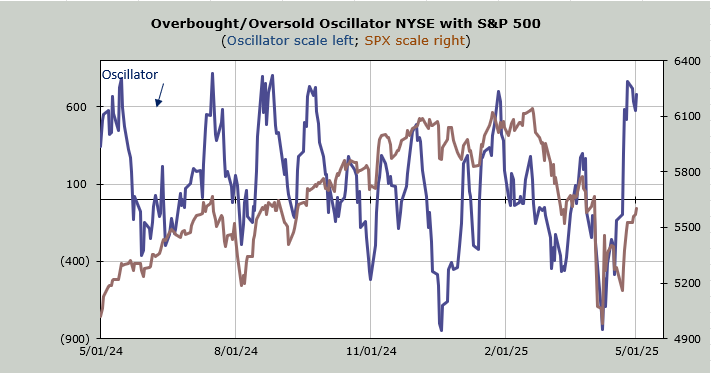
I have noted breadth has been good; notice that the blue line (breadth) is higher than it was in mid-March. That is bullish. Notice the S&P (brown) is not yet at that mid-March high. So breadth has been outperforming. But now notice the last two days (you need to squint), breadth has stalled out while the S&P has kept on going.
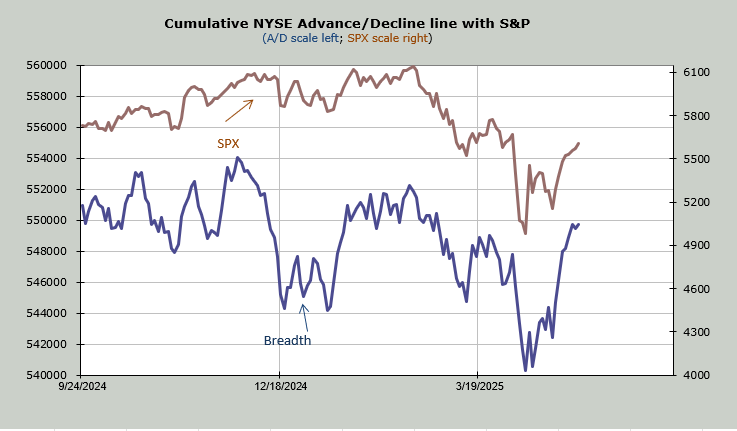
We’ll watch this because if breadth starts to falter, it will change the indicators (from up to down). I note this because we’re finally starting to see a shift in sentiment, not just anecdotally but statistically.
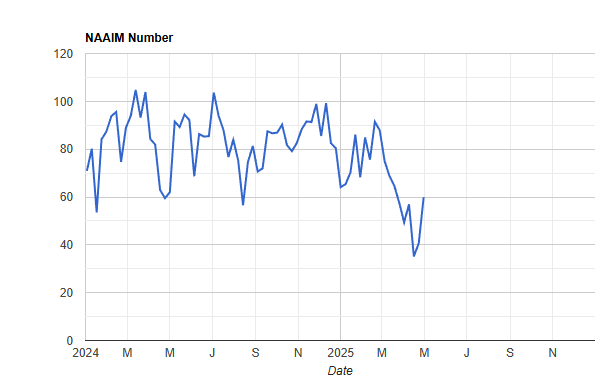
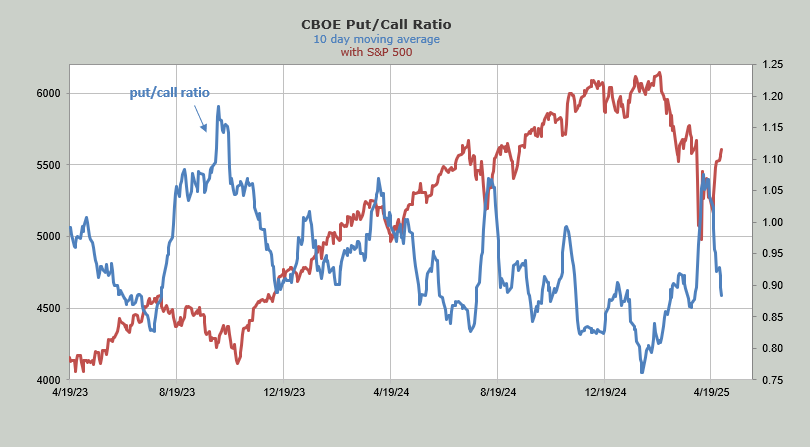
The NAAIM Exposure has lifted to 60 (from 35), and that was before Wednesday evening’s earnings releases. And the ten-day moving average of the put/call ratio has now pushed down to .88. Under .85, and it tells me folks have changed their views.
For the time being, I still think chop and it’s too soon to expect any serious downside. But as you can see, I’ve got some things on the radar to watch.