An Economic Sweet Spot, Strange Game of Battleship, Early Santa?
Let's deep dive into the yield spread, look at the strange move toward battleships, and check Norvo Nordisk, Google, Warner Bros. Discovery.
You've reached your free article limit
You've read 0 of 1 free Pro articles.
Not Playing Ball? Or are they? In what some may see as a fiscal warning shot (I do not, at least not yet), the longer end of the U.S. Treasury yield curve is not coming in at the same pace as is the short end. Others see this differently. Some see this as a "risk-on" environment, driven by expanding yield spreads or what's commonly referred to as a "bull-steepener."
The U.S. Three-Month T-Bill mostly paid between 4.3% and 4.39% from the start of 2025 right up until early August. The Federal Open Market Committee started reducing the overnight Fed Funds Rate for the year at the Sept. 17 policy meeting and has now shaved three-quarters of a percentage point off of that rate for this easing cycle. This has broadly pressured short-term rates.
Now, pay attention. The U.S. Ten-Year Note paid as much as 4.79% in January of 2025. That yield collapsed throughout the first third of the year, as U.S. Ten-Year paper hit resistance at the 4% level. Then as the short end of the curve collapsed, the longer end stabilized. The Ten Year, while still hitting that 4% resistance on multiple occasions, has found support below 4.2%. (Remember, with debt securities, the relationship between price and yield is inverse, hence when speaking of support and resistance, at least here, we are referring to price, though we reference yield.)
This has created a yield spread between the U.S. Three-Month T-Bill and the U.S. Ten-Year Note that looks like this:
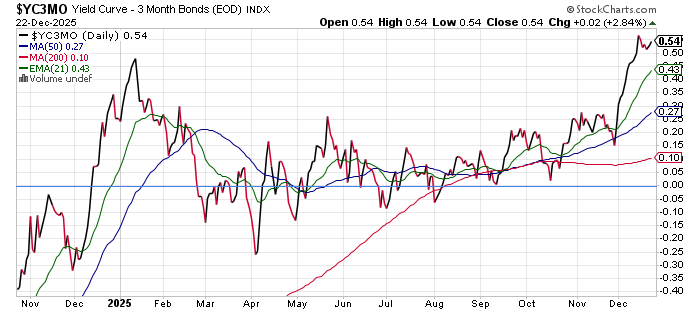
Readers need to remember that a negative spread between Three-Month and Ten-Year U.S. paper is considered one of the most accurate measures that we have of either a current or coming economic slowdown. A broader but not truly broad spread is actually a sign of economic optimism. Should the long end of the curve get away from investors and the influence of the central bank, which is not yet evident here, that could reflect increased potential for inflation and / or over-indebtedness and a potential for actual fiscal crisis.
Let's go back further, and we see what this spread did during the pandemic:
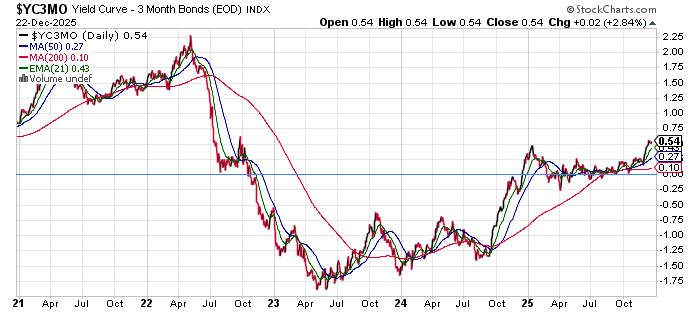
Readers will see that this spread apexed above +200 basis points in early to mid-2022 when consumer-level inflation ran above 9% and then troughed into deeply negative territory when there was that deep discrepancy between what was reported by the Bureau of Economic Analysis as gross domestic product and gross domestic income. It may be difficult to recall in late 2025, but for the fourth quarter of 2022, the Bureau of Economic Analysis reported a quarter-over-quarter seasonally adjusted annual rate GDP growth of 2.8%, despite Q4 2022 quarter-over-quarter GDI coming in at a seasonally adjusted annual rate of -2.3%. Again, the two are supposed to match. The Fed considers GDI to be a check against the accuracy of GDP.
For the entirety of 2022, GDP grew 2.9%, while GDI grew just 1.7%. The bulge in this spread preceded and foretold the burst of inflation that the U.S. economy experienced. The trough in this spread foretold an era of restrictive monetary policy and somewhat tougher economic times. Where this spread is right now as long as it can hang on here and not run, foretells neither. This may be the sweet spot for the economy, at least statistically.
By that I mean, that as 2026 dawns, so does a less regulated economy and so do lower taxes. As generative and agentic artificial intelligence move from their infancy toward something more democratized from a commercial perspective and broadly integrated, productivity will rise, and perhaps even soar -- productivity per worker, that is. This will create, possibly (I don't want to get ahead of myself) a perfect environment for economic growth, margin growth -- even if sales do not rise -- and ultimately, corporate earnings growth.
My fear is that demand for labor will shrink in this highly productive environment and the U.S. economy will look strong statistically, despite a perhaps severely weakened labor market. The global economy is behind due to lack of investment in artificial intelligence, but they will get to this point too. How to tackle this future? Especially for those individuals still reliant upon salary or wages paid by an employer? In my opinion, stay invested. Learning to trade the markets could help, but depending upon individual skill sets, that could also hurt. By being invested, "they" may take your livelihood, but at least you'll share in their "success."
Marketplace
Am I a little concerned that equity markets have been so strong going into the traditional Santa Claus rally period? A little. Though there is a chance that Santa came early this year due to the pro-growth policies set to kick in as the calendar rolls into 2026, the run up into Christmas may also make it more difficult to produce gains in between Dec. 24 and Jan. 5 this season.
The Santa Claus rally has returned an average of 1.6% for the S&P 500 and its predecessor since 1928 and finished in the green for the period 77% of the time. According to Oppenheimer, that compares to an average return of 0.2% and a 57% positivity rate for any random seven-day trading period throughout the year.
That said, the 2023 and 2024 Santa Claus periods posted negative returns and the S&P 500 has never put three losing years together in its history. On average, still sticking with numbers provided by Oppenheimer, should Santa fail, the January through March period for the incoming year has returned an average of -1.6%. So, we're really, really rooting for Santa. This year, the S&P 500 did not retake its January high until June, though Liberation Day had something to do with that.
Breadth
Every single mid-major to major U.S. equity index I know of finished in the green on Monday, led by the KBW Banks, Russell 2000 and Philadelphia Semiconductors, all of whom gained at least 1.1%. The S&P 500 and Nasdaq Composite gained a more pedestrian 0.64% and 0.52% respectively. Ten of the 11 S&P sector SPDR ETFs finished the day on the plus side with four of these funds gaining at least 1%. The Financials (XLF) , led by Citigroup (C) and the Materials (XLB) led by Alcoa (AA) were the day's winners as cyclicals to the top four slots on the daily performance tables. Only the Staples (XLP) lost ground on the day.
Winners beat losers by a rough 5-to-3 margin at both the NYSE and the Nasdaq. Advancing volume took a 71.6% share of composite NYSE trade and a 65.7% share of composite Nasdaq-listed activity. All, good, but from the "take it with a grain of salt" department, aggregate trading volume collapsed to holiday levels. Trade was down 47.8% on a day-over-day basis across NYSE-listings and down 43.7% across Nasdaq-listings. Keep in mind that Friday was a "triple witching" expirations event so a large drop-off on Monday is semi-normal to begin with.
News
- Novo Nordisk (NVO) is up more than 7% overnight as the Food and Drug Administration has approved an orally administered version of the Wegovy obesity treatment. The pill will launch in January. Eli Lilly (LLY) is down more than 1% overnight.
- The battle for control of Warner Bros. Discovery (WBD) goes on. Netflix (NFLX) has already refinanced a portion of its planned $59 billion in new debt that it would have to take on in order to assure that the company's corporate debt maintains an investment-grade rating. Meanwhile, Larry Ellison, Chairman and CTO at Oracle (ORCL) has agreed to irrevocably guarantee $40.4 billion of his own dough in order to solidify his son's (David Ellison) bid. David Ellison is CEO of Paramount Skydance (PSKY) .
- Alphabet (GOOGL) has agreed to acquire Intersect Power for $4.75 billion in cash plus existing debt. Do the other hyper-scalers, all in need of increased supplies of energy for their data centers, follow suit and simply purchase their own generator / suppliers?
A Battleship?
Really? The last U.S. battleship commissioned was the USS Missouri in 1944. The last U.S. battleship to participate in combat was the USS Wisconsin during Operation Desert Storm in 1991. Both of those ships are now museums. Battleships had become obsolete and in operations against a near-peer adversary would present as large, expensive targets, much like aircraft carriers, but with less of an ability to defend themselves. They had become little more than coastal artillery support for Marines engaged in land-based combat.
On Monday, Pres. Trump unveiled plans for a new "Trump-class" battleship that would become the centerpiece of a U.S. "Golden Fleet." Plans are for as many as 25 of these ships, but the Navy would start with just two. What do I think? With the advent and development of both airborne and seaborne drone warfare, I am not sure if this is pure folly or if the ability for large warships to both defend themselves and project power has been enhanced.
That said, shipbuilder Huntington Ingalls Industries (HII) was up 5% on Monday and then up another 5% overnight. Last week, the U.S. Navy also announced plans for a new class of frigates. Battleships? Not sure the new battleships are wise. The "Trump" class? Call it something else, Mr. President. The "Bull" Halsey class would have a nice ring to it. A famous fighting admiral from World War Two that other than a Leahy class cruiser and a Fletcher class destroyer has never had anything other than a typhoon named after him.
Economics
(All Times Eastern)
08:30 - Durable Goods Orders (Oct): Expecting 0.3% m/m, Last 0.5% m/m.
08:30 - ex-Transportation (Oct): Expecting -1.4% m/m, Last 0.6% m/m.
08:30 - ex-Defense (Oct): Expecting -0.8% m/m, Last 0.1% m/m.
08:30 - Core Capital Goods Orders (Oct): Expecting -0.1% m/m, Last 0.9% m/m.
08:30 - GDP Growth Rate (Q3-rev): Flashed 3.2% (q/q SAAR).
08:55 - Redbook (Weekly): Last 6.2% y/y.
08:30 - Industrial Production (Oct): Expecting 0.1% m/m, Last 0.1% m/m.
08:30 - Industrial Production (Nov): ?
08:30 - Capacity Utilization (Oct): Expecting 75.9%, Last 76%.
08:30 - Capacity Utilization (Nov): Expecting 75.8%.
10:00 - Consumer Confidence (Dec): Expecting 89.0, Last 88.7.
10:00 - Richmond Fed Manufacturing Index (Dec): Expecting -6, Last -15.
4:30 - API Oil Inventories (Weekly): Last -9.3M.
The Fed
(All Times Eastern)
No public appearances scheduled.
Today's Earnings Highlights (Consensus EPS Expectations)
No significant quarterly earnings scheduled.
At the time of publication, Guilfoyle had no position in any security mentioned.
