Economic Data Appears to Brighten
Housing starts, core capital goods and even durable goods, beat expectations as the market saw what could signal an appetite for risk -- despite some technical obstacles. Let's dig in.
You've reached your free article limit
You've read 0 of 1 free Pro articles.
"From every ruin, life springs up again and everything that dies is born again."
- Isabelle Eberhardt (1877-1904)
Lemonade From Lemons?
The data poured in on Wednesday. The data was broad in nature, and for the most part, significantly better than expected. First, housing starts for December grew from November and decisively beat what had been the consensus view. December was the strongest month for housing starts since July. It gets better. Much better.
December durable goods orders also crossed the tape on Wednesday morning. Something of a slowdown had been expected as November had been an exceptional month for this series. At the headline, Durable goods orders printed at -1.4% from November. Not so hot, but still better than what had been the professional opinion coming in. Let's look into the data, though. We owe ourselves at least that much. Those orders, outside of transportation (planes, vehicles, etc.) actually printed at +0.9% month over month vs. expectations for +0.3%.
How about core capital goods, which is a proxy for business investment? That line hit the tape at +0.6% vs. expectations for something close to +0.2%. Business investment, ex-defense, and ex-transportation, on equipment was strong in December after a strong November and has remained strong for six consecutive months. That does not sound like an economy that's dying on the vine.
There's More...
Later on, still Wednesday morning, January industrial production also crossed the tape. There were downward revisions to the December data. That much is true. But the January print recovered all of the ground lost through those revisions and then some. For January, industrial production grew 0.7% on a month-over-month basis with strength seen in manufacturing and exceptional strength seen across the utilities. Expected in January? Should have been priced in is my answer. Capacity utilization soared in January from a downwardly revised 75.7% to 76.2%, which is the strongest print since August for that line. Miners carried the football as far as utilization is concerned. Interesting.
Upturn in Markets
Equities, led by growth and the AI-trade, as well as energy stocks, were strong for most of the session on Wednesday. Is that a sign that investors are preparing to take on more risk? Perhaps. Still, there are significant technical hurdles left unchallenged. After a mid-afternoon swoon, the S&P 500 closed up 0.56% while the Nasdaq Composite gained 0.78%. Broader markets outperformed the small and mid-cap indexes that all also closed in the green as the Dow Transports and KBW Banks again outperformed. I want you to take a look at this:
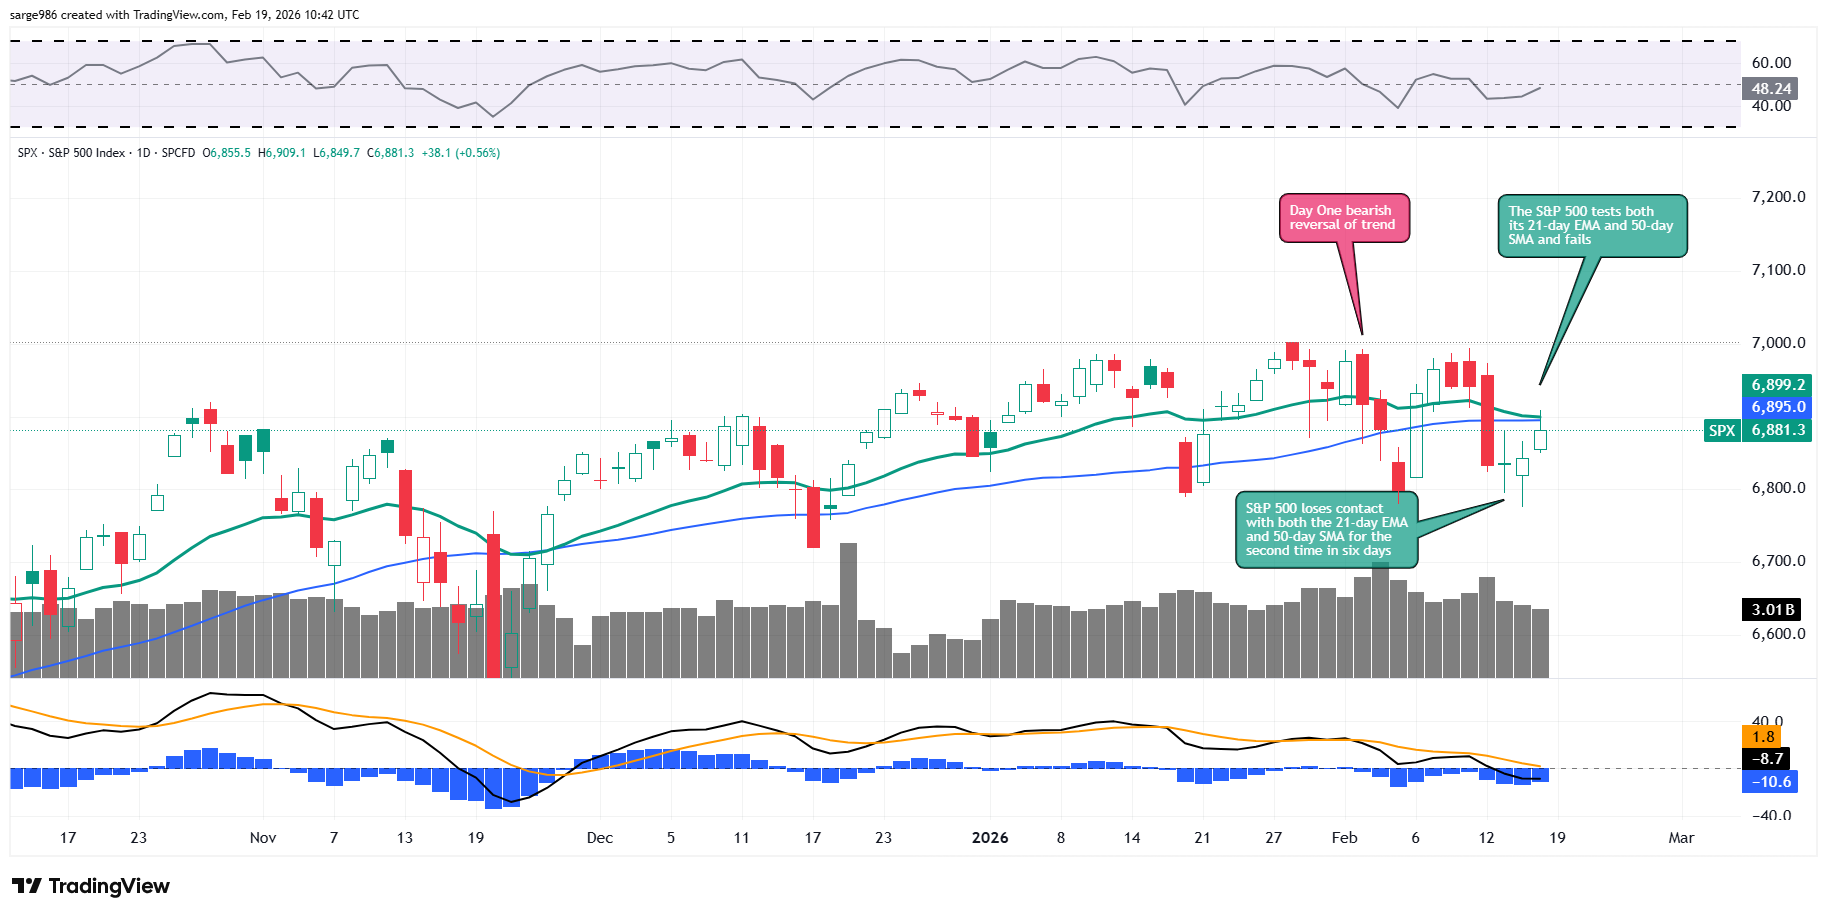
Can you read my caption describing Wednesday's action? It reads "The S&P 500 tests both its 21-day exponential moving average and 50-day simple moving average and fails." Is it significant, from a technical perspective, that the index failed at those lines on Wednesday? Well, if the market never makes another run at those lines, certainly. You see, for the new kids, a lot of swing and retail traders watch an act at the 21-day Exponential Moving Average. Getting that crowd on board is necessary for driving momentum for any market move.
Now, even more important is the fact that many professional portfolio managers will watch and act at both the 50-day and 200-day simple moving averages. Getting these folks on board, as they represent large institutions, has a significant impact on the overall flow of capital. There's more to it than that. At almost all of the large investment banks, broker-dealers and hedge funds, these portfolio managers now have risk managers and in many cases the risk managers are far less sophisticated than are the portfolio managers.
These risk managers often will not green-light large changes in portfolio allocation until these lines on the chart are breached. Is that somewhat ridiculous? Of course, but one must remember that many portfolio managers have never graduated from Wall Street. They fear losing things like base salaries and truly testing their metal. The addition of the risk manager to the "block trading" team has created what is often an adversarial culture of office politics, where overriding the advice of one of those types, if wrong, could be deadly to a career.
If one has never gone independent and succeeded, that can be terrifying. Hence, portfolio managers and algorithms written for portfolio managers follow the "rules" like never before. That's the main reason behind the fact that technical analysis is so much more accurate than it was thirty years ago. Wall Street has become the domain of cowards, lemmings and robots. That also creates vast opportunities for those of us who prey upon these folks.
Real Strength?
Happy day? Kind of. Seven of the 11 S&P sector SPDR exchange-traded funds closed out the regular session on Wednesday in the green, led by energy (XLE) and technology (XLK) . Within tech, the Dow Jones US Semiconductor Index gained 1.27% led by Micron (MU) , as the Dow Jones U.S. Software Index added 1.04%, led by Cadence Design (CDNS) . Cyclical sectors took four of the five top slots on the daily performance tables in response to the stronger macroeconomic data. Defensive sectors rode in the caboose on Wednesday, as the utilities (XLU) and the REITs (XLRE) were slapped around for losses greater than 1%.
Winners beat losers by a four-to-three margin at the NYSE and by a rough seven to five at the Nasdaq. Advancing volume took a 65.2% share of composite NYSE-listed trade and a 65.1% share of composite Nasdaq-listed trade for the day. All impressive given that afternoon bout of market weakness. As far as aggregate trading volume is concerned, there was a slight day over day increase across Nasdaq-listings, but activity did ebb a bit across NYSE-listings and across the membership of the S&P 500. In fact, that's three successive days of declining volume across the S&P 500 since the last "down" day last Thursday. This could be reflective of caution ahead of that test on Wednesday at the S&P 500's 50-day simple moving average. This could be why we are seeing some market weakness overnight.
Inside 'the' Why?
Why was there a swoon in stock prices on Wednesday afternoon? Some of it was trepidation going into and some of it was an algorithmic reaction to the Fed Minutes released at 2 p.m. ET. Understand that back when stickball and roller hockey players from Brooklyn and Queens ran the point of sale that three-week old anecdotal information would not impact markets like that.
This is because mostly Irish, Italian and Jewish guys and gals who grew up on the streets of New York City did have some street smarts and did have a modicum of common sense. Keyword reading algorithms have none of that. Hence, the powers that be, have exactly what they wanted. That is an inefficient marketplace prone to market overshoot by design, where common sense never gets in the way.
Those keyword-reading algorithms fund this line, stating that some (members of the Federal Open Market Committee) "Judged that additional policy easing may not be warranted until there was a clear indication that the progress of disinflation was firmly back on track." It got worse. Several members noted that a rate increase "Could be appropriate if inflation remains at above-target levels."
Echoes of Thursday...
- Traders and investors will be watching Walmart (WMT) earnings closely as the retail portion of the season kicks off. Comp store sales, profit margins and e-commerce sales growth will be in focus.
- Weekly state level jobless claims will also be in focus a day after that bevy of stronger-looking economic numbers hit the tape. Labor market data has been the "Achilles Heel" of the economy in recent months as most other data-points are moving in the right direction.
- Most importantly, traders, investors, portfolio managers and especially risk managers will be watching the S&P 500's 50-day simple moving average. That is where the next battle will be fought.
Economics
(All Times Eastern)
08:30 - Balance of Trade (Dec): Last -$56.8B.
08:30 - Goods Trade Balance (Dec): Last -$85.9B.
08:30 - Initial Jobless Claims (Weekly): Expecting 227K, Last 227K.
08:30 - Continuing Claims (Weekly): Last 1.862M.
08:30 - Philadelphia Fed Manufacturing Index (Dec): Expecting 8.6, Last 12.6.
08:30 - Wholesale Inventories (Dec-adv): Expecting 2.5% m/m, Last -9.3% m/m.
10:00 - Pending Home Sales (Jan): Expecting 0.2% m/m, Last 0.2% m/m.
10:00 - CB Leading Indicators (February): Expecting -0.3% m/m, Last -0.3% m/m.
10:30 - Natural Gas Inventories (Weekly): Last 249B cf.
12 p.m. - Oil Inventories (Weekly): Last +8.53M.
12 - Gasoline Stocks (Weekly): Last +1.16M.
The Fed
(All Times Eastern)
09:00 - Speaker: Minneapolis Fed Pres. Neel Kashkari.
Today's Earnings Highlights
(Consensus EPS Expectations)
Before the Open: (ETSY) (1.36), (LMND) (-.43), (WMT) (.73), (W) (.69)
After the Close: (DBX) (.67), (LYV) (-1.05)
At the time of publication, Guilfoyle had no position in any security mentioned.
