Echoes of 'The Crash'
We're hearing a lot of correction and crash comparisons, but remember this one: Oct. 16, 1987. Also, let's look at more tariff talk and chart a two-day ... 'Day One'.
You've reached your free article limit
You've read 0 of 1 free Pro articles.
There have been several stock market "crashes" over the years. I think two stand out head and shoulders above the rest. Of course, we cannot discuss crashes without discussing "Black Thursday", October 24th, 1929. That kicked off the crash of 1929 that really took about four business days to play out. That crash, which would see the Dow Jones industrial average lose 89% by July 1932, led into the "Great Depression" that only ended with the explosion in federal spending and necessary full employment conditions demanded by the Second World War. This one, I only heard about from my grandfathers, gang.
Then there was what for me, was "The Crash." That came on "Black Monday," October 19th, 1987. The Dow Jones industrial average (still the primary measure for U.S. stock market performance at the time) lost 22.6% in a single trading session. My spot on the NYSE trading floor that day was just under the podium (where the bell is rung), right in front of Post 9, which is now the CNBC NYSE studio. NYSE trading volume for that day was three times the daily average, and at that time, we traded each and every share the old-fashioned way, priced in Spanish pieces of eight and in the old open-outcry, two-way, ongoing auction model. No circuit breakers. No time-outs.
As usual, the closing bell rang at the New York Stock Exchange that day at 4 p.m. ET. On a normal day, we would be done with our paperwork by sometime between 5 p.m. and 6 p.m. That day, the trading floor looked like it was still open for business at 11:30 p.m., when I took my first break of the day. It would be like that all week. It would be like that for many weeks. I called my fiancé, now my wife of many decades, that night from outside the NYSE where there was a bank of payphones. I told her that it would probably be a while until we saw each other again.
Since then, we've had the mini-crash of 1989, the dot-com bubble crash of March 2000, we had the 9/11 terrorist attacks that ultimately landed me back in the U.S. military after a long break in service, and we had the crash of 2008 that led to, or rather was a symptom of the "Great Recession" or "Great Financial Crisis."
We've also had the Covid Crash of 2020. I worked straight through that one, without missing a single day, despite becoming quite ill with the first variant of that virus and a horrific bout with Long Covid that lasted more than two years. Now this? Is this a crash? It might be. I don't count the flash crashes. Those only happened because Wall Street replaced human traders with algorithms. Thursday and Friday did have that sickening feeling hanging over them. Futures opened on Sunday night in the same ugly fashion that they went out with on Friday. That reminds me. Friday, Oct. 16, 1987, was a fairly awful day for U.S. markets as well. Buckle those chinstraps, kids.
Oh, Joy, for the Hedge Funds
On Friday afternoon, the Financial Times reported the hedge funds were experiencing their most significant margin calls since the Covid Crash of 2020. According to investment bank Morgan Stanley's most recent prime brokerage report, last Thursday went down as the worst trading day for U.S. long/short equity hedge funds since that report started tracking the data back in 2016.
The volume of hedge fund selling of equities last Thursday, matched some of the most extreme examples on record. That includes both the Covid crisis and the domestic regional banking crisis of March 2023. On the bright side, net leverage across long / short equity strategies fell to roughly 42% as funds de-risked. This is the lightest level of current leverage as measured in this way in 18 months.
With Trading Friends Like These....
The Trump team made the rounds across the Sunday morning news shows this past weekend. Was there news? Is there hope? White House National Economic Council Director Kevin Hassett appeared on ABC's "This Week" with George Stephanopoulos. Hassett said, "I got a report from the (presumably the U.S. Trade Representative) last night that more than 50 countries have reached out to the president to begin a negotiation. But they're doing that because they understand that they bear a lot of the tariff. And so, I don't think that you're going to see a big effect on the consumer in the U.S."
That sounded somewhat optimistic to me. Unfortunately, Hassett was not the only member of the administration that was out and about on Sunday. Treasury Sec. Scott Bessent appeared on NBC's "Meet the Press" with Kristen Welker. Bessent did back up Hassett on the 50 nations having called to start negotiations. Then he cautioned, "They have approached the administration about lowering their non-territory barriers, lowering their tariffs, stopping currency manipulation, and Kristen, you know, they've been bad actors for a long time, and it's -- it’s not the kind of thing you can negotiate away in days or weeks."
Lastly, U.S. Commerce Secretary Howard Lutnick appeared opposite Margaret Brennan on the CBS News program "Face the Nation." On the recently announced tariffs, Lutnick was quite blunt: "There is no postponing. They are definitely going to stay in place for days and weeks. That is sort of obvious. The president needs to reset global trade. Everybody has a trade surplus, and we have a trade deficit. We are paying away our future and our lives ... the countries of the world are ripping us off, and it's got to end. The President has made it crystal, crystal clear."
The Numbers
What the major to mid-major U.S. equity indexes did as equity markets were roasted over an open fire...
- The S&P 500 gave up 5.97% on Friday and 9.08% for the week.
- The Nasdaq Composite gave back 5.82% on Friday and 10.02% on the week.
- The Nasdaq 100 surrendered 6.07% on Friday and 9.77% for the week.
- The Russell 2000 gave up 4.37% on Friday and 9.7% for the week.
- The S&P Small Cap 600 gave back 4.21% on Friday and 9.1% for the week.
- The S&P Mid Cap 400 gave up 4.83% on Friday and 9.14% for the week.
- The Dow Transports lost 3.38% on Friday, and 9.82% for the week.
- The Philly Semiconductors surrendered 7.6% on Friday and an incredible 16.04% for the week.
- The KBW Bank Index lost 6.59% on Friday and a stunning 13.81% for the week.
On Friday, all 11 S&P sector SPDR ETFs closed in the red, led lower by Energy XLE as investors priced in the likelihood of an economic recession. Energy dropped 9.2% on Friday followed by the Financials XLF and Technology XLK. Those two funds were down 7.32% and 6.59% respectively. Incredibly, the Discretionaries XLY were Friday's "top" performing fund among the eleven at -4.31%.
For the week, as for Friday, all of eleven of these funds closed in the red. Energy was again the big loser at -14.79% as eight of these SPDRS lost at least 6%. Not surprisingly, all four defensive sectors, while still losing ground, outperform all seven growth and cyclical sectors.
Earnings
First quarter earnings season begins in earnest this coming Friday when some of the large banks begin to report their numbers. There will also be a few non-banks that beat them out of the gate, but once the banks start to report, it's pretty much "game on" for traders and investors. Then again, our ranks always seem to thin out whenever we go through times like this, so we'll see who's still standing when we get to the other side.
Remember, for the banks...while volatility is usually good for their trading desks, it also depresses investment banking activity. Additionally, a flatter slope for the yield curve will result in compressed net interest margin. Banks will also have to set aside greater reserves for anticipated business and household defaults ahead of any potential recession all as demand for credit contracts.
I also am wondering how many firms, in this new era of extreme uncertainty, despite what appears to be some negative certainty, will actually issue forward looking guidance. Many firms did not offer guidance for a year or more after the Covid shutdowns and Covid era supply constraints. Will they resort to that kind of evasive behavior yet again? I know if I were CEO of a multinational corporation, that's exactly what I would do.
According to FactSet, for the first quarter, on a year over year basis... the S&P 500 is expected to report earnings growth of 7% on revenue growth of 4.2%. That's down from 7.3% on 4.2% a week ago, so margin contraction has already started to be priced in. More than a month ago, the expectation was for earnings growth of more than 11%. Health Care is expected to have had a nice quarter, sporting earnings growth of more than 35%. Four sectors are expected to post Q1 earnings contraction led the wrong way by Energy and the Materials.
For the full year 2025, Wall Street now sees earnings growth of 11.3%, down from 11.5% a week ago and down from 14.8% more than a month ago), on revenue growth of 5.4%.
As for valuation, the S&P 500 went into this past weekend trading at 19.4 times forward looking earnings, down from 20.5 times a week ago) and 24.2 (down from 25.5 a week ago) times 12-month trailing earnings. This is now the five-year average for the S&P 500 of 19.9 times forward looking earnings and 24.6 times trailing twelve-month earnings.
It should be noted, still pulling data from FactSet, that first quarter bottom-up S&P 500 earnings estimates have contracted by 4.2% since the start of the quarter to $60.23 (from $62.89). This is greater than the 3.3% average contraction during a reporting period over the past five years and the 3.2% average contraction during a reporting period over the past 10 years.
The GDP Game
This is what the current volatility is really all about. Tariffs? Interest rates? The Trump administration? The Fed? No. This is about the possibility of a recession. A real one that we don't just spend our way out of at the expense of our grandchildren. Perhaps as the economy transitions from something it was into something else. For better or worse.
The Atlanta Fed revised their GDPNow model for the first quarter... back to "growth" of -2.8% (q/q, SAAR) last week, up from -3.7% earlier in the week. Ex-the gold trade, Atlanta sees a Q1 GDP of -0.8%. There is no consensus in regard to this contraction. Among other regional central bank district branches running close to real-time GDP models for the current quarter, the New York Fed's estimate for Q1 growth now stands at 2.6%, down from 2.86%, while the Cleveland Fed left its model at growth of 1.86%. The St. Louis Fed's model was revised over the weekend down to growth of 2.01% from 2.13%.
Where is Hedgeye's Nowcast Model? You know that I am not comfortable giving away their store and if you're a reader of mine, you know that I trust their work enough to pay for it because quite simply, I have outsourced the need for a staff. Hedgeye is now contractionary of a q/q, SAAR basis for the first quarter.
On That Note...
On Friday, JP Morgan updated its outlook for the U.S. economy to show economic contraction for both Q3 2025 and Q4 2025, while final sales contract in both Q1 and Q3. The firm sees consumer spending contracting in Q3. Bluntly put, JP Morgan expects a U.S. recession to make landfall at some point between mid-year through the second half.
A Two-Day 'Day One?'
Maybe. Maybe more than two days. Remember that Bear Flag I showed you last week? Was that ever an accurate interpretation of a chart made by David Keller of Sierra Alpha Research. Give the man credit, He nailed it. Now, after three light trading volume "up-day's" the S&P 500 went into high-volume liquidation mode.
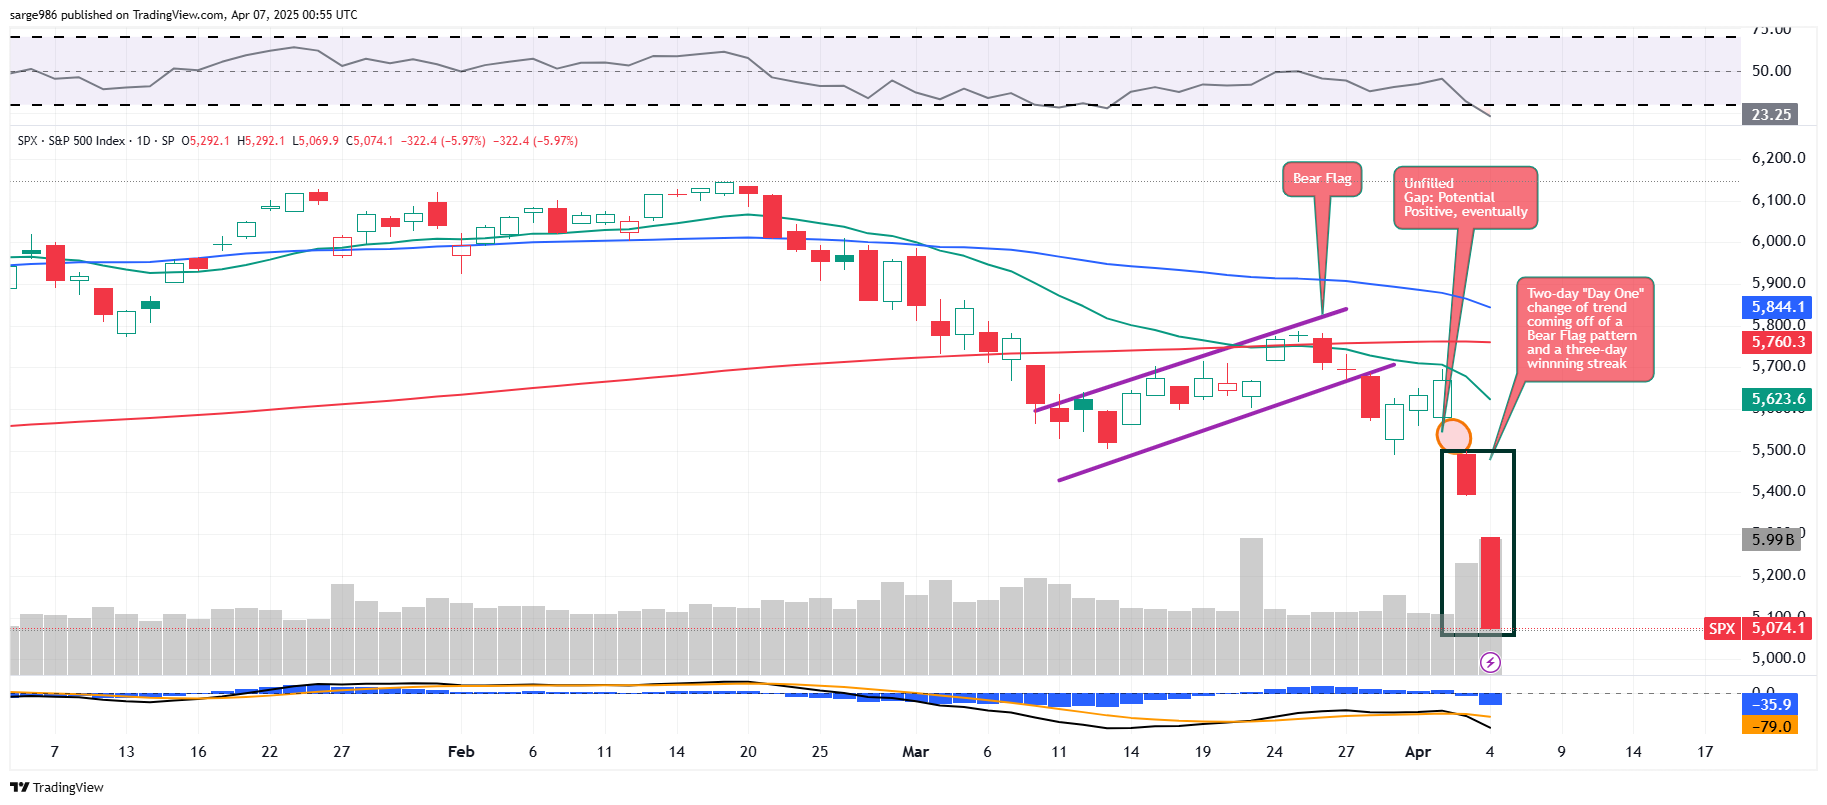
Remember, there has to be a break in between a Day One change of trend and a Confirmation Day. Right now, we just have back-to-back down days. The whole thing and add to that today (Monday) if futures are any indication, adds up to one move. Nothing, bad as it is, has even been confirmed as of yet. That doesn't mean that there is less volatility around the corner.
Relative strength (above the chart) is more than relatively weak. In fact, it's showing a technically oversold reading. The daily Moving Average Convergence-Divergence indicator (below the chart) is postured extremely bearishly with the 9-day exponential moving average (blue field), 12-day EMA (black line) and 26-day EMA (gold line) all well below the zero bound. Additionally, the 12-day line is running well below the 26-day line. It does not get much short-term uglier than that.
Place in History?
The S&P 500 gave up 10.53% over Thursday and Friday and closed on Friday down 17.42% from the most recent high for the index. What the dingbats on financial TV refer to as a bear market (because none of them have ever managed risk through an extended one) is the "down 20%" mark. There is a very high likelihood that the S&P 500 opens close to that level on Monday. The Nasdaq Composite is already there, at -22.9% from its most recent high.
To put those two days for the S&P 500 in perspective, last week's culmination was not quite as gnarly as the 13.93% lost on March 11th and 12th, 2020 or the 12.42% lost on Nov. 19 and 20, 2008. For the two-day record, we go back to that Friday and Monday (Oct. 16 and 19) in 1987 when the index surrendered 24.57%. Rock & roll.
What's Ahead?
- Treasury auctions off $39 billion worth of Ten-year Notes on Wednesday and $22 billion worth of Thirty-Year Bonds on Thursday.
- March CPI is due on Tuesday. Continued deceleration is expected. March producer price index is due Friday. First signs of re-accelerating inflation are expected to be visible at the wholesaler / producer level.
- At least seven Fed officials including Gov. Michelle Bowman (on Thursday) are scheduled to speak publicly this week. Bowman is thought of as a policy hawk. Futures markets are currently pricing in one percentage-points worth of short-term interest rate cuts from here into the year's end. The FOMC Minutes of the policy meeting that culminated on March 19th will be published on Wednesday afternoon.
- The earnings calendar remains extremely light this week. However, Q1 earnings season will kick-off. Well-known names that are reporting do include Levi Strauss LEVI this afternoon, followed by Delta Air Lines DAL and Constellation Brands STZ on Wednesday. On Thursday, we'll hear from CarMax KMX. Then, finally, on Friday, the dam breaks and BlackRock BLK, Bank of New York Mellon BK, JP Morgan JPM, Morgan Stanley MS and Wells Fargo WFC all report.
Economics (All Times Eastern)
3:00 p.m. - Consumer Credit (Feb): Last $18.08B.
The Fed (All Times Eastern)
10:30 - Speaker: Reserve Board Gov. Adriana Kugler.
Today's Earnings Highlights (Consensus EPS Expectations)
After the Close: LEVI (.28)
At the time of publication, Guilfoyle was long WFC equity.
