Drawing Some Lines in the Sand
As stocks make a lower high, let's see where things could start to get interesting.
You've reached your free article limit
You've read 0 of 1 free Pro articles.
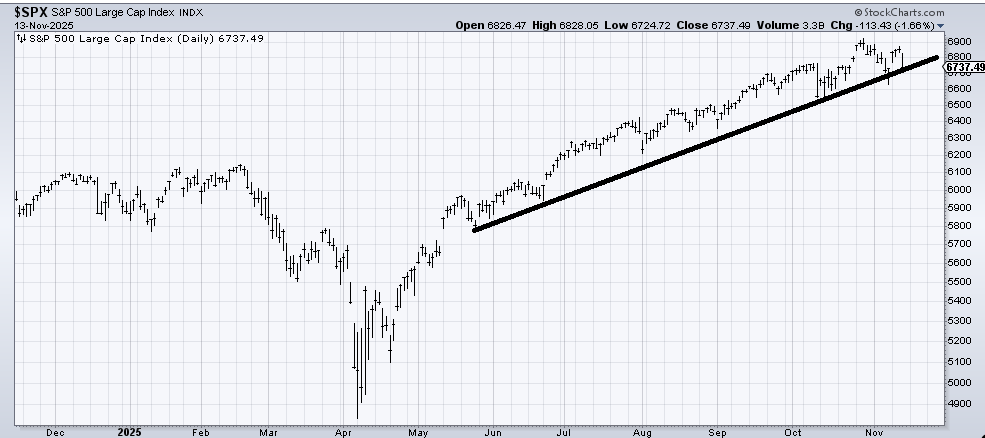
The big-cap indexes have done a round trip from last Friday. Nasdaq is a bit lower while the S&P is a bit higher. And so, we find the S&P right back at the line.
There is a minor difference this time (vs. last week): this time we have a rally to a lower high on the chart. That is the Monday through Wednesday rally. It often makes it easier to break the line once there has been a failing rally.
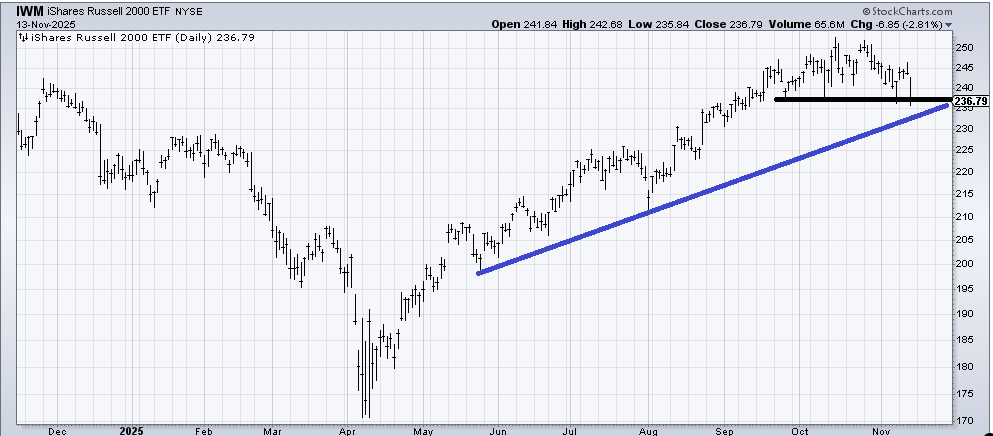
There is another line I suspect folks will be focused on. It’s on the chart of the Russell 2000. We’ll use the ETF IWM to show it. It’s flat and it has held since the late September sell-off. And while we’re not talking about an uptrend line here, we do have a failing rally in place from late October. The first support after breaking that line—should it happen—would be at the blue line.
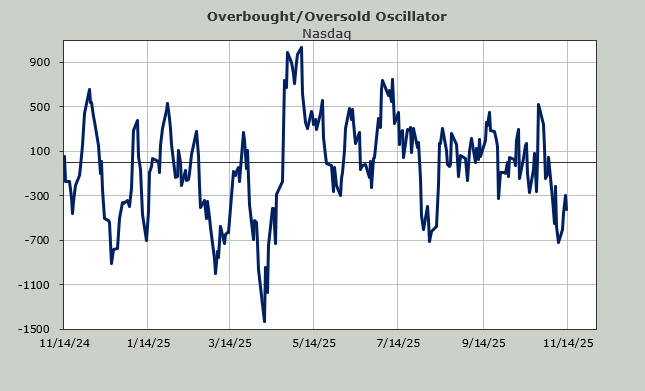
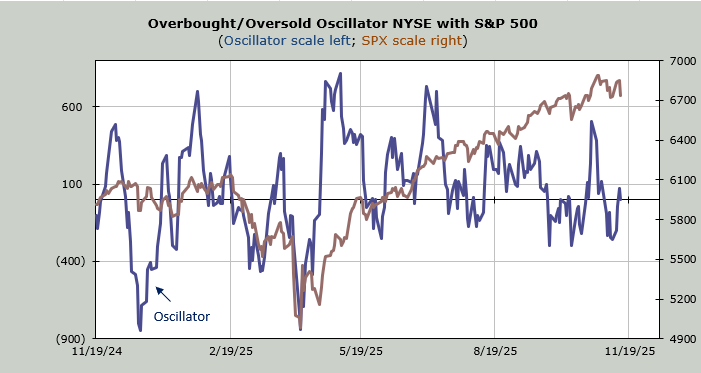
Now, when you look at the Overbought/Oversold Oscillator, you may wonder, why wasn’t it down more after Thursday’s action? Because the 493 are still a bit oversold. Or at least not overbought yet. You might have noticed there wasn’t much selling outside of the tech names, which we have discussed (perhaps too much!), and the financials, which have been strong. Most of the other stocks were down a bit. Or flat.
Just take a look at downside volume. The NYSE had 80% on the downside (high but not excessive), and Nasdaq, where all the selling was concentrated, had 63% of the volume on the downside. So if you were looking for panic, there was not much of it.
Another sign there was little or no panic is that the put/call ratio was .81. Recall last Friday it was 1.08. Oh sure, someone will say they weren’t buying puts, they were selling. But then why was downside volume only at 63%?
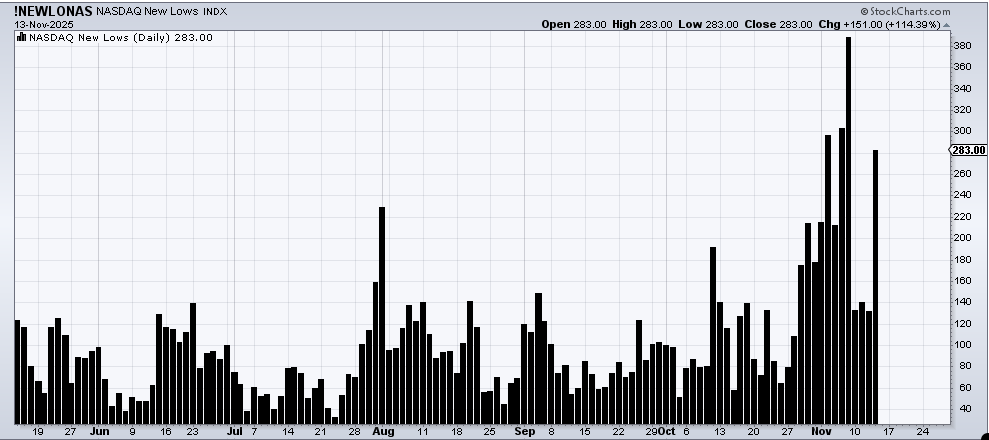
Then there are the stocks making new lows. Despite all the tech selling Nasdaq did not see more new lows this week than last Friday. Now I grant you that we did not make a new intraday low (only a new closing low), but we’ll monitor this since, at least for now, the new lows did not increase.
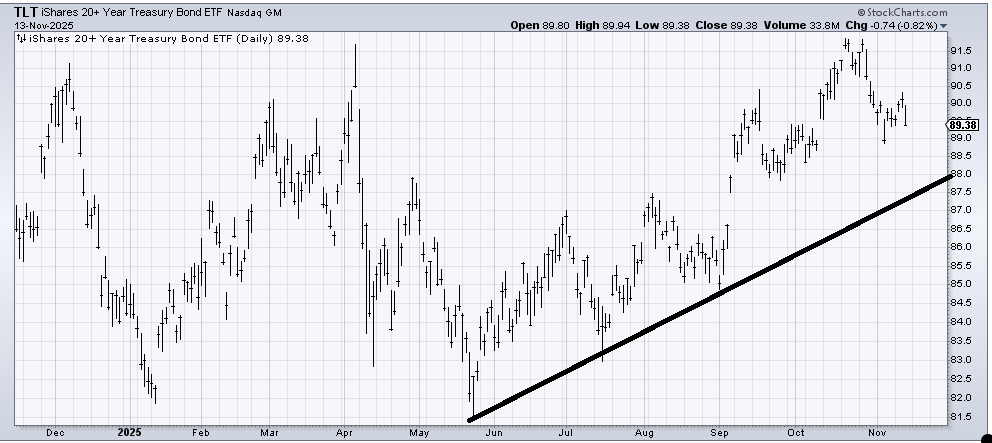
Finally, there are the bonds. I still don’t have a strong view on them (except that I did not and still don’t think TLT will get over 92 for the time being). But there is a head and shoulders pattern developing (albeit with an upslanting neckline). For now, I think that uptrend line area (87-ish) is likely to hold, but I see chatter has changed drastically from a gazillion rate cuts coming our way to ‘oh maybe no cut in December’.
Perhaps selling the fan faves is what will finally change sentiment.