Does Washington, DC Have More Influence Over Stocks Than We Want to Admit?
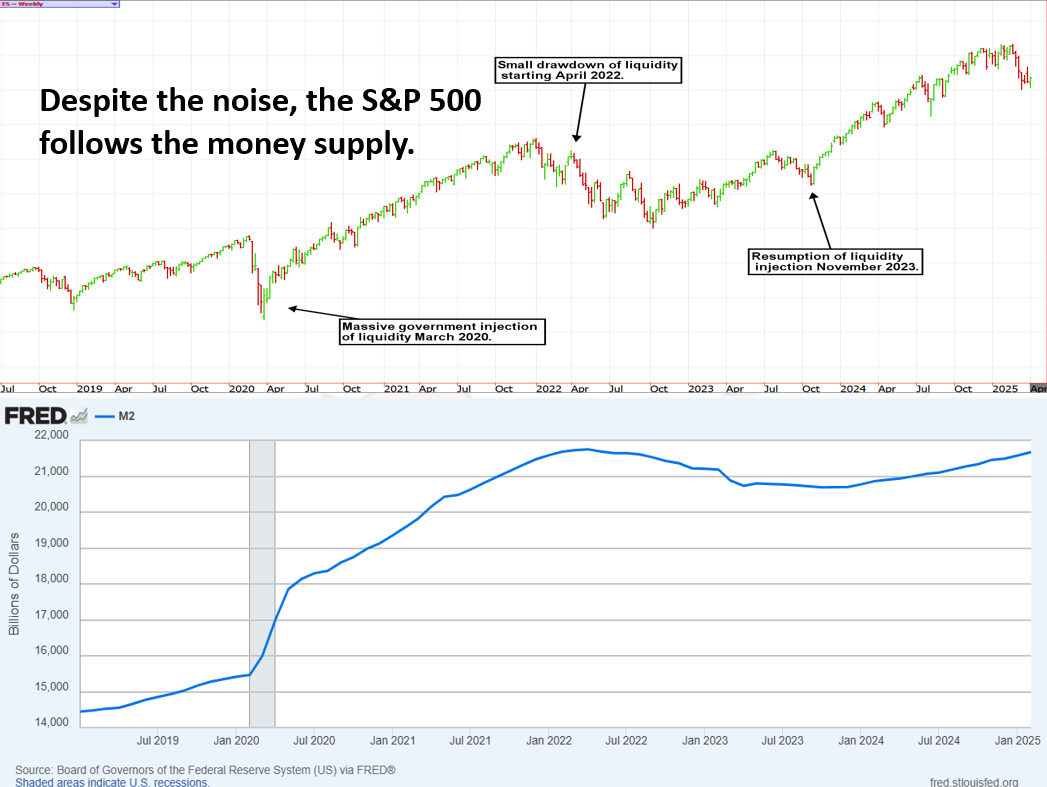
Despite the noise, the S&P 500 follows the money supply. Just as we've been told not to fight the Fed, we shouldn't fight the Treasury Secretary in the coming years.
You've reached your free article limit
You've read 0 of 1 free Pro articles.
Financial news headlines would lead us to believe that the stock market is in the midst of a painful crash, but monthly charts of the S&P 500 and Nasdaq 100 tell a different story.
While the door is open for a much larger, more painful, and necessary correction, thus far, the selling has been orderly and within normal back-and-fill confines. With that said, those with heavy concentration in the tech sector, or more specifically, the tickers known as the Magnificent Seven, have suffered the biggest blow. For instance, the S&P 500 and Nasdaq are roughly 10% from all-time highs, while stocks like Nvidia NVDA are down 20%, and Tesla TSLA is down nearly 30%.
Is AI and Technology Merely a Convenient Excuse to Employ Excess Capital in the Markets?
In my opinion, before the correction, the components of the Magnificent Seven, and therefore the major indexes, were wildly overpriced and had no mathematical basis for trading at the multiples they were. Like consumer inflation, asset inflation occurs when there are too many dollars chasing too few goods.
There are numerous narratives explaining why the stock market and certain stocks have amassed impressive gains since 2020. Still, none of it would have been possible without the help of government stimulus through monetary policy and spending bills.
Despite the noise, government liquidity injections drive market prices. Below is a comparison of the M2 money supply and the S&P 500 from 2019.
M2 money supply includes cash, checking and savings deposits, money market securities, and mutual funds. There is a clear relationship between market price and money supply. It can be argued that banks, through their lending practices, and consumers, through their behavior, influence the supply of money in the economy. Yet, there is only one entity capable of directly increasing or decreasing the money supply: the U.S. government, primarily through the Federal Reserve.
Politicians on both sides of the isle, and yes, the so-called Independent Fed, have made it a habit of avoiding business cycles and offering a “Fed put” under the equity market because their jobs depend on it during the next election cycle. Investors, too, are drunk on stimulus and what they believe to be risk-free returns.
We don’t know how it all ends, but we should all be aware of the reality of the game being played. For full disclosure, these bad habits were formed in 2009 during the Global Financial Crisis and have spanned multiple decades and administrations. So, even if we are right about a hard landing, the timing is wildly uncertain.
Since the October 2023 low, the majority of stock speculation and even investment dollars have been concentrated on momentum names. This rush to a handful of stocks has left traditionally diversified portfolios in the dust while rewarding risk-takers.
For instance, while the Mag 7 was generating profits in the accounts of aggressive investors, the average mom-and-pop portfolio, with a mix of stocks and bonds, has yet to reach its 2021 highs. In other words, although doom scrolling on X in early 2025 seemed to reveal an embarrassment of riches for those playing the upside in high-flying names, the vast majority of sensible investors were not participating in the fun. The Vanguard Life Strategy Moderate Growth Fund, which offers a textbook 60/40 portfolio with domestic and international exposure to stocks and bonds, remains approximately 10% off its peak value from November 2021.
This is not a sustainable environment, and in recent weeks, we have taken a step toward normalization. But the question is, is a standard S&P 500 correction enough to right the wrongs of excessive money supply increases? We don’t believe it is.
As Chamath Palihapitiya recently posted on X, “All of this fake money needs to be shaken out of the economy for us to know where we are really at.” However, significant technical support levels are coming into play that will determine whether the reset is imminent, or we kick the can down the road again.
S&P 500: Ignore the Noise, Here is the Big Picture
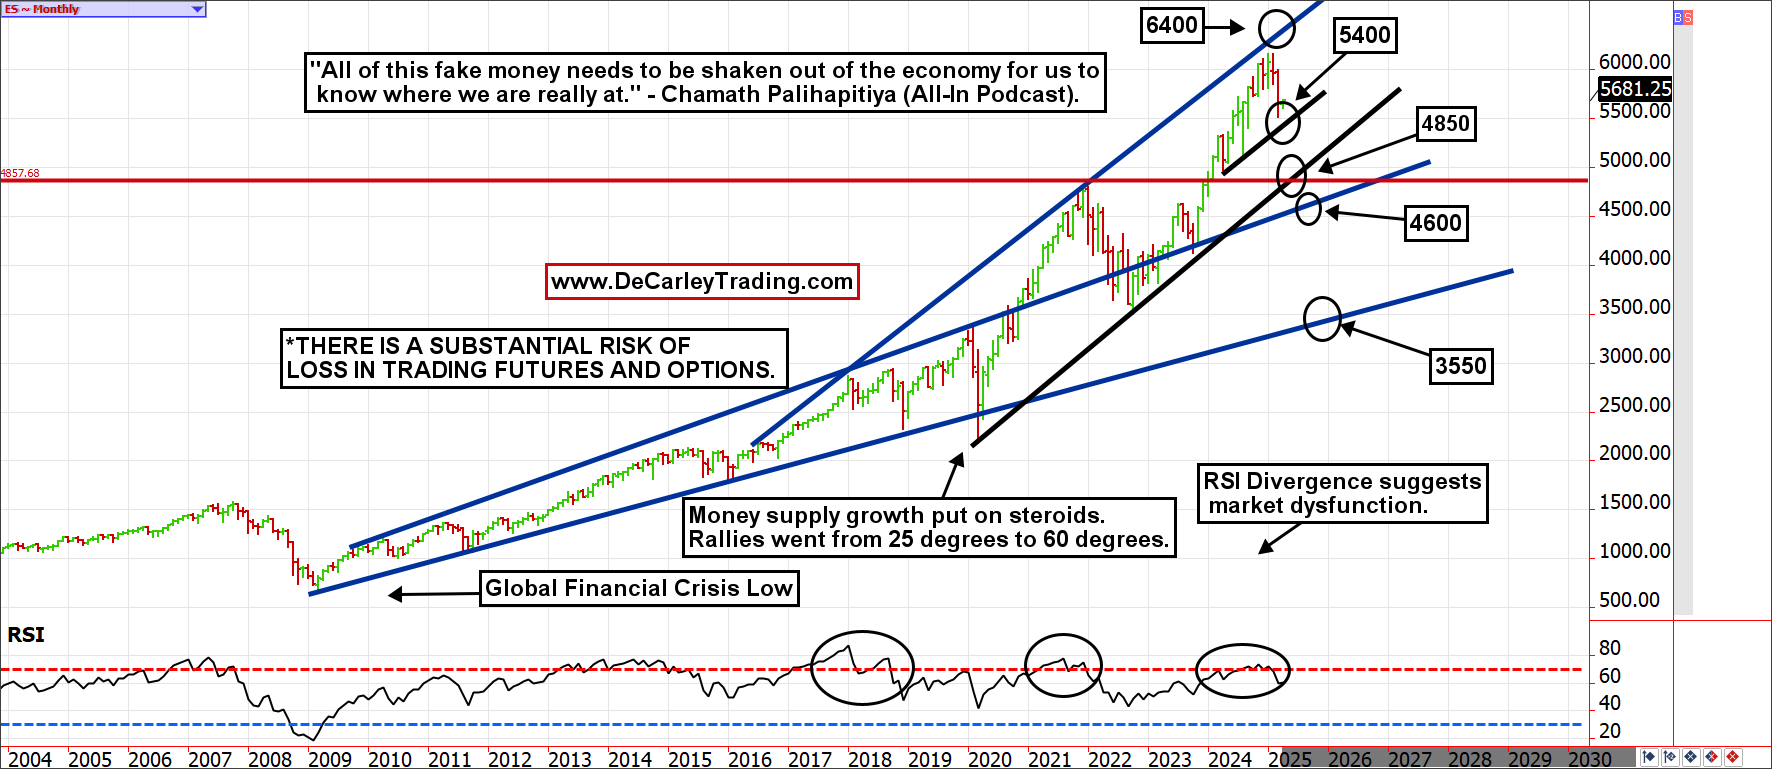
A monthly chart of the E-mini S&P 500 displays a bull market merely back-and-filling from overbought levels. The April and August 2024 lows form an internal trendline that provides support at 5400. This would be a 12% correction from the January 2025 high. Most corrections are 10% to 13%, so if this level holds, it would be a run-of-the-mill pullback and reload for the next leg higher.
Failure of the bulls to defend 5400 opens the door to a much more significant decline, with 4850 and 4600 as likely targets. These levels would represent 21% and 25% corrections, respectively; these levels would be annoying but not barn burners.
Yet, we can’t unsee the long-term trendline dating back to the financial crisis at 3550. This would represent a 42% correction from the recent high. We are not expecting this, but it is worth admitting it isn’t impossible. After all, without historically excessive increases in money supply, we believe the market would have mostly traded within the band depicted by the blue lines or a 4600 to 3550 range. In other words, we’ve been living off our future prosperity, and it can be taken away at any time.
Tech Stocks: Is the Nasdaq 100 on Performance Enhancing Drugs?
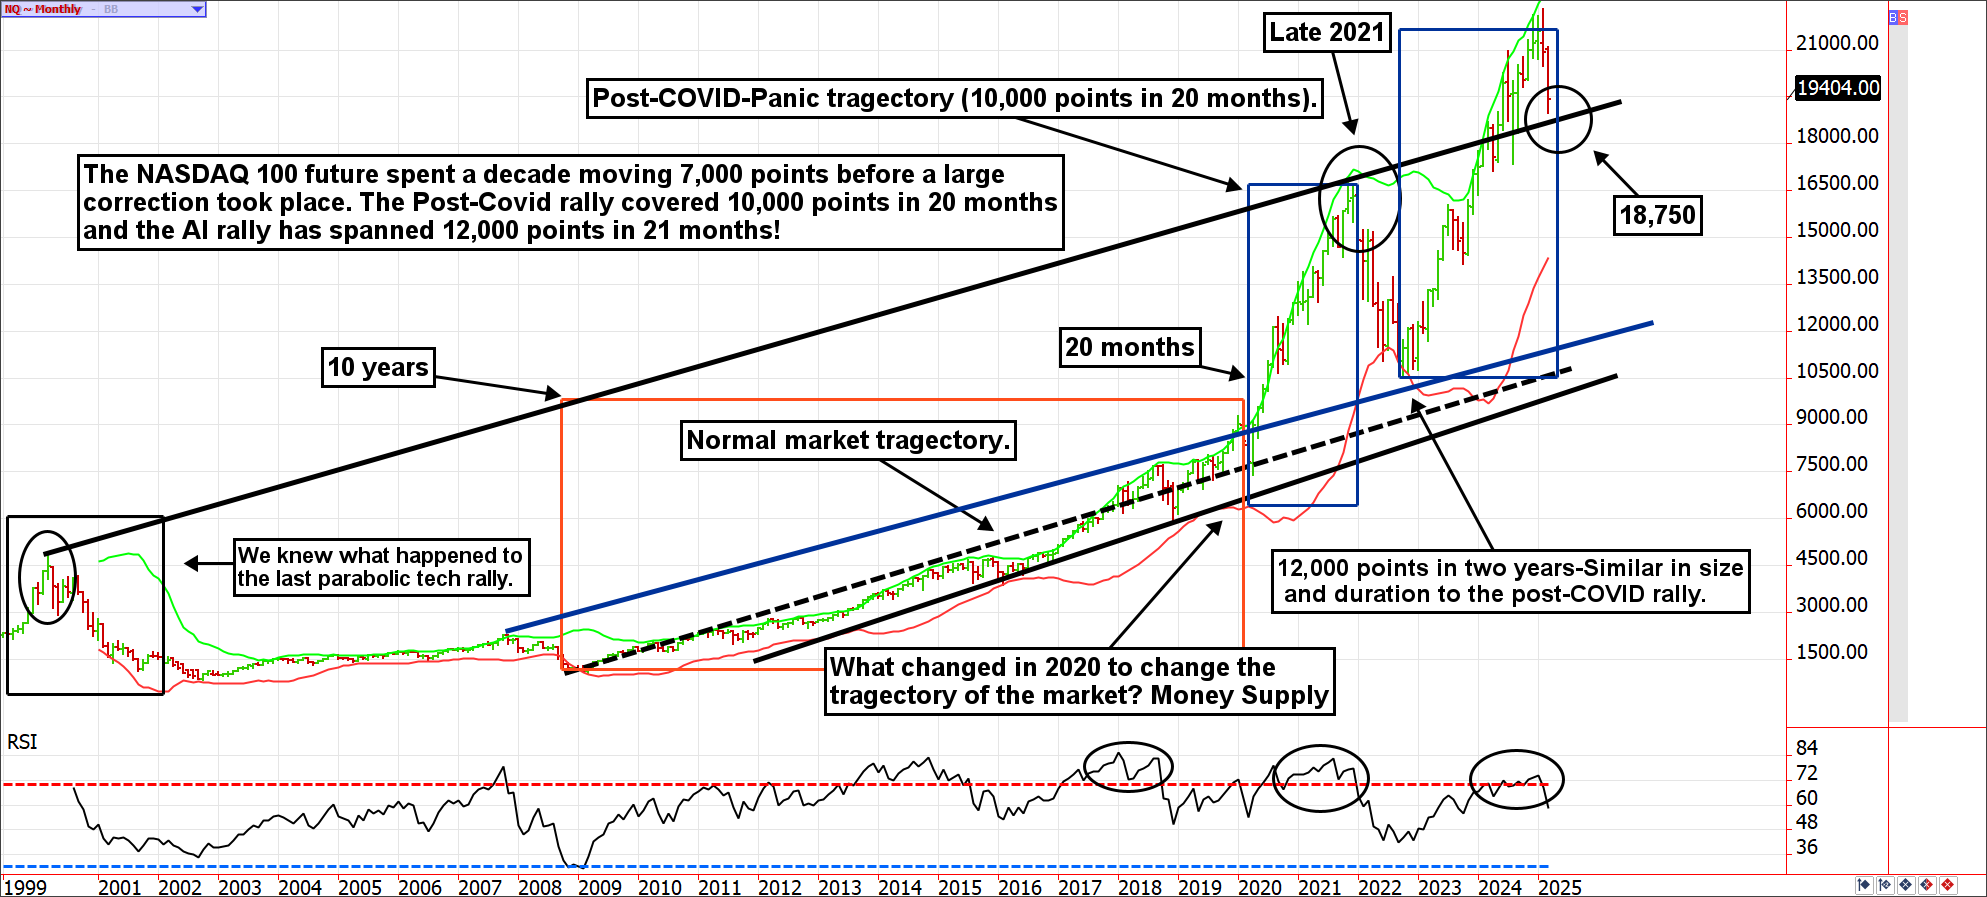
For the Nasdaq 100, the critical level will be 18,750. The bulls have an edge above, but the bears will press the gas below. This, too, is a sobering look at what a normal market looks like vs. a market on performance-enhancing drugs; rallies are steeper, and corrections are deeper.
Many metrics suggest that we’ve captured a decade of gains in just over two years. Perhaps we will eventually be able to justify this with AI-driven growth, but the odds and history suggest otherwise.
Bottom Line
In summary, we believe the market's personality has undergone a dramatic shift. Rather than market participants habitually buying dips, they will probably be more focused on selling rips. Once these types of habits are formed, it is hard to break them.
Furthermore, the current US administration has been clear about its intention to shift wealth from Wall Street to Main Street by thwarting inflation and lowering interest rates. The policy aims to reverse the effects of pandemic-era monetary and fiscal policy, which exacerbated the wealth gap. A bazooka-style stimulus campaign enabled hyperinflation to boost the prices of both assets and goods and services.
Those able to participate in asset inflation didn’t feel the pinch of higher prices as a consumer. Yet, those who were unable to hold onto assets saw their household budgets decimated by inflation. In short, “the rich got richer, and the poor got poorer.”
We don’t know if Treasury Secretary Bessent can accomplish this goal, and if he does, whether he can avoid catastrophe. However, just as we have been told not to fight the Fed, I don’t think we should fight the Treasury Secretary in the coming years.
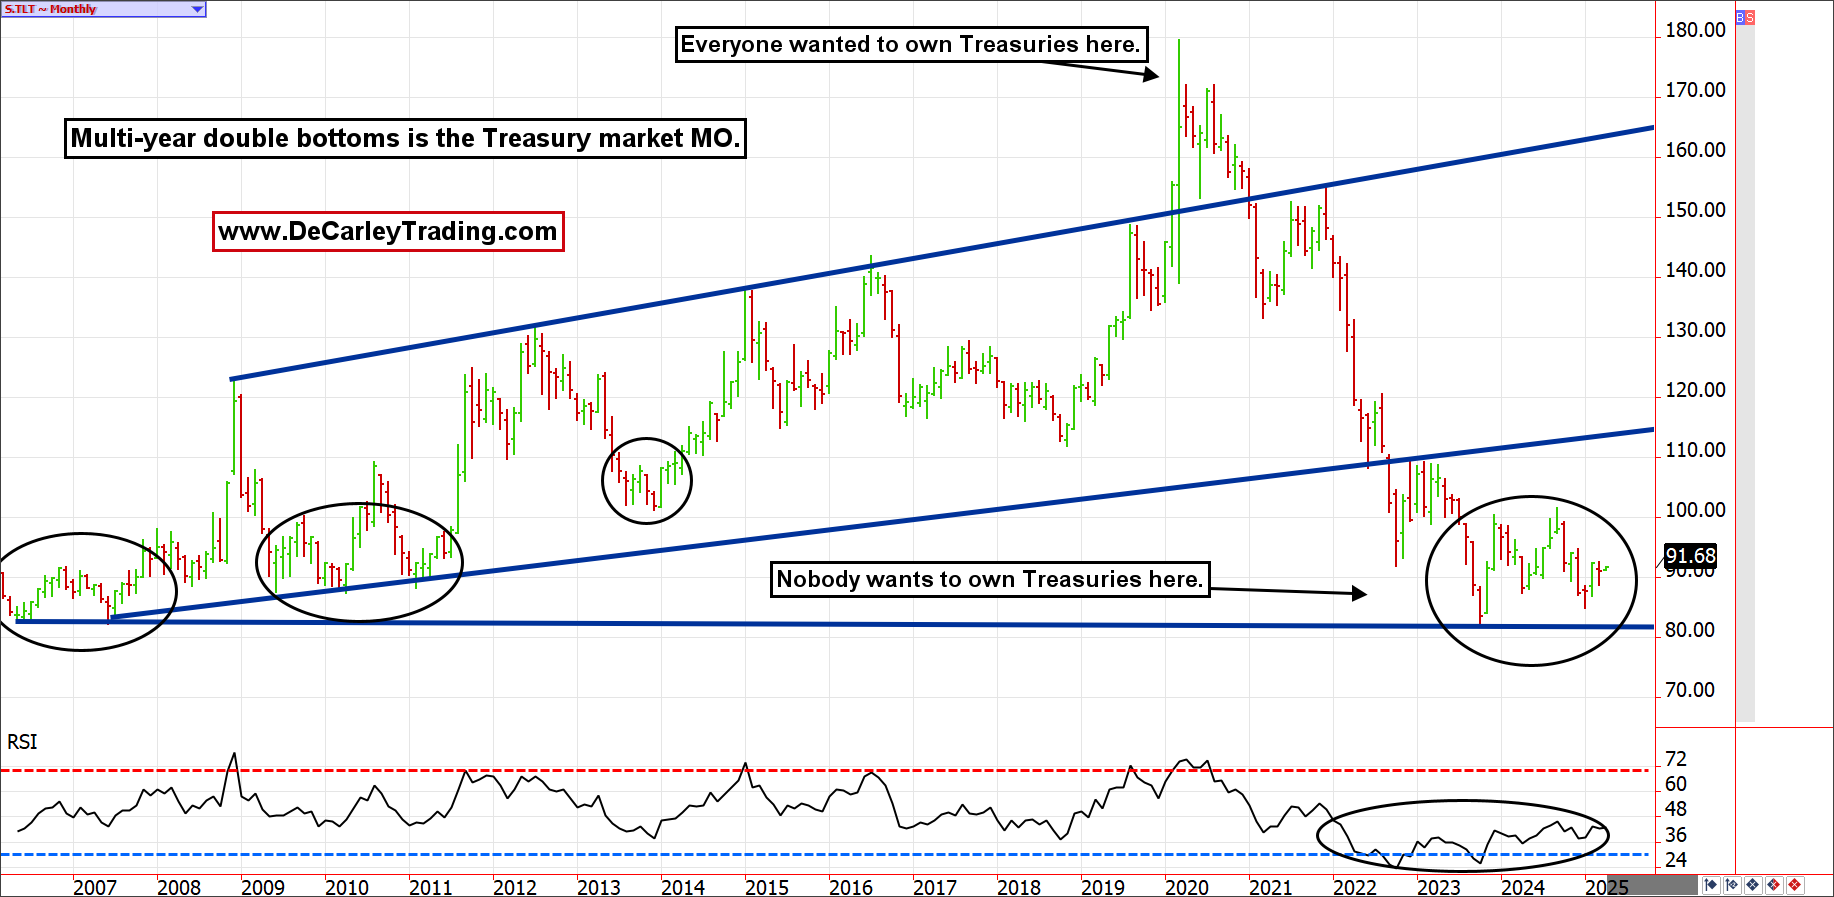
In short, what has been working might not work for the time being, and what wasn’t working probably will. In essence, Treasuries could regain popularity while the stock market takes a much-needed breather.
If you are a conservative, balanced fund investor who missed out on stock pickers’ wealth creation, it might be your turn to get in on the gravy train.
