Delayed Payroll Report Could Spike Volatility
Nvidia and non-farm payrolls could further amp up the unpredictability this week.
You've reached your free article limit
You've read 0 of 1 free Pro articles.
Monday was a gloomy day on the stock market, as the two most important indexes violated key support levels. Now, investors are waiting for Nvidia (NVDA) earnings and the non-farm payroll report, to see if that lost ground can be recovered.
Here are three charts-and one major event that investors can't afford to ignore.
1. The S&P 500
Three weeks ago, the S&P 500 closed at an all-time high. The large-cap index lost nearly 1% on Monday. It was the third consecutive lower close for the index.
Worse, the index closed beneath its 50-day moving average (blue) for the first time in six months (arrow). Investors are waiting to see if the S&P 500 can climb back above that key moving average
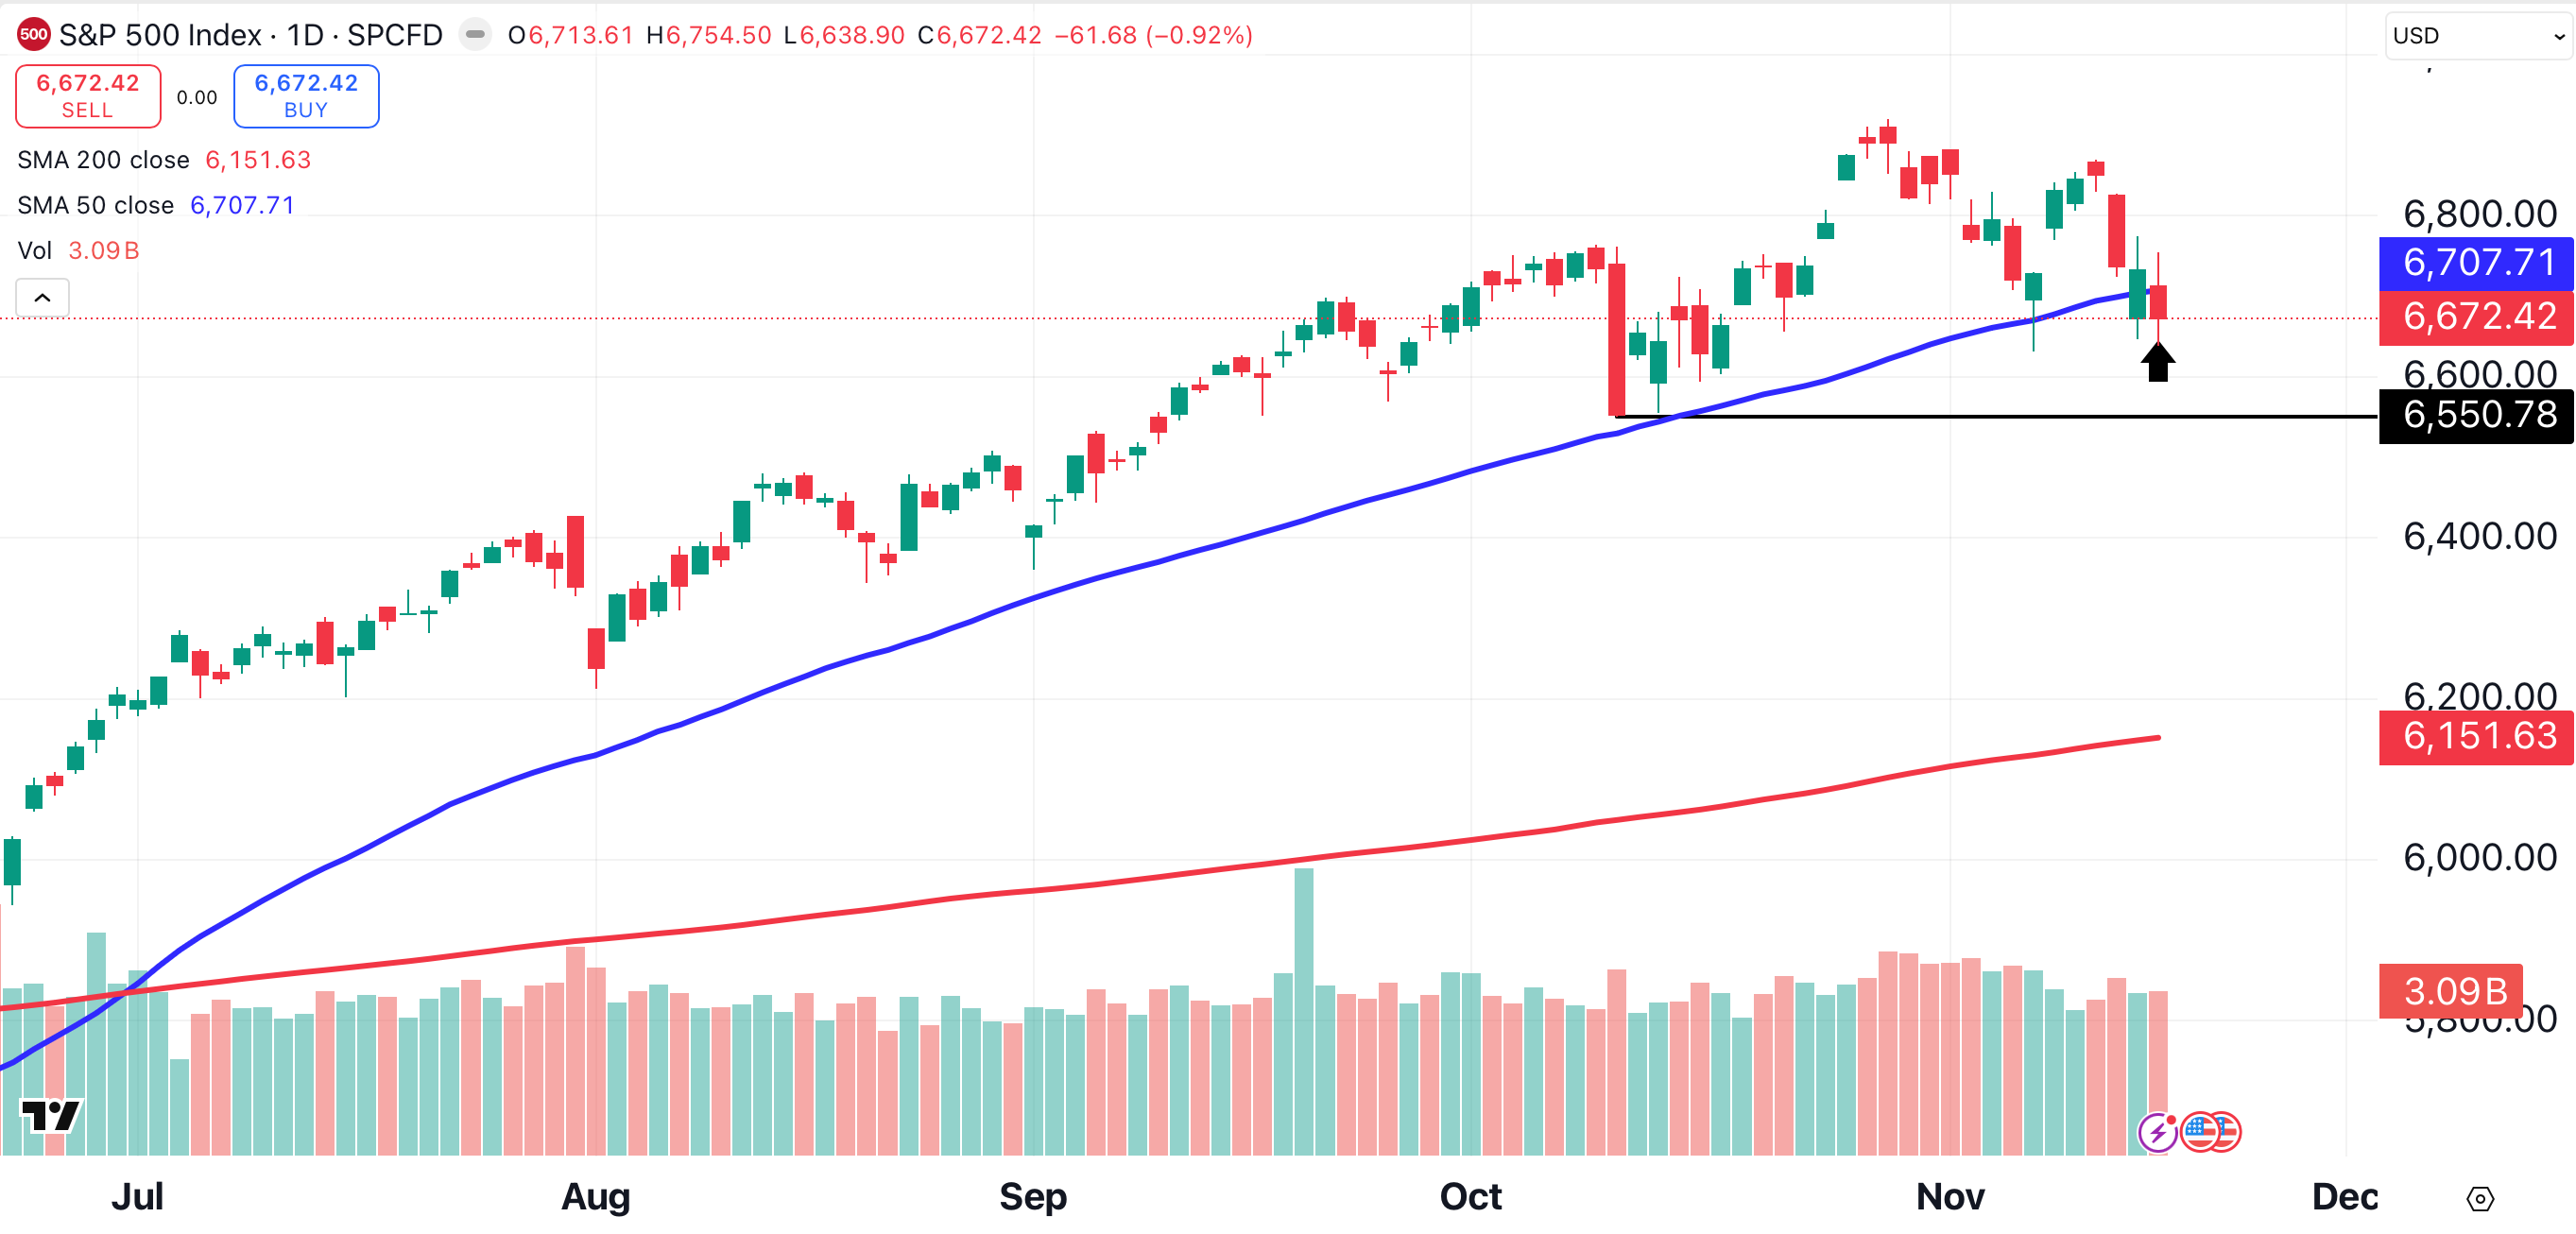
Investors are also be watching to see if the index will find support at 6,550 (solid black line). This figure represents the October 10 low. Traders are expecting a bounce if the S&P 500 reaches 6,550, but if that level breaks, more sellers could be drawn into the market.
2. The Nasdaq Composite
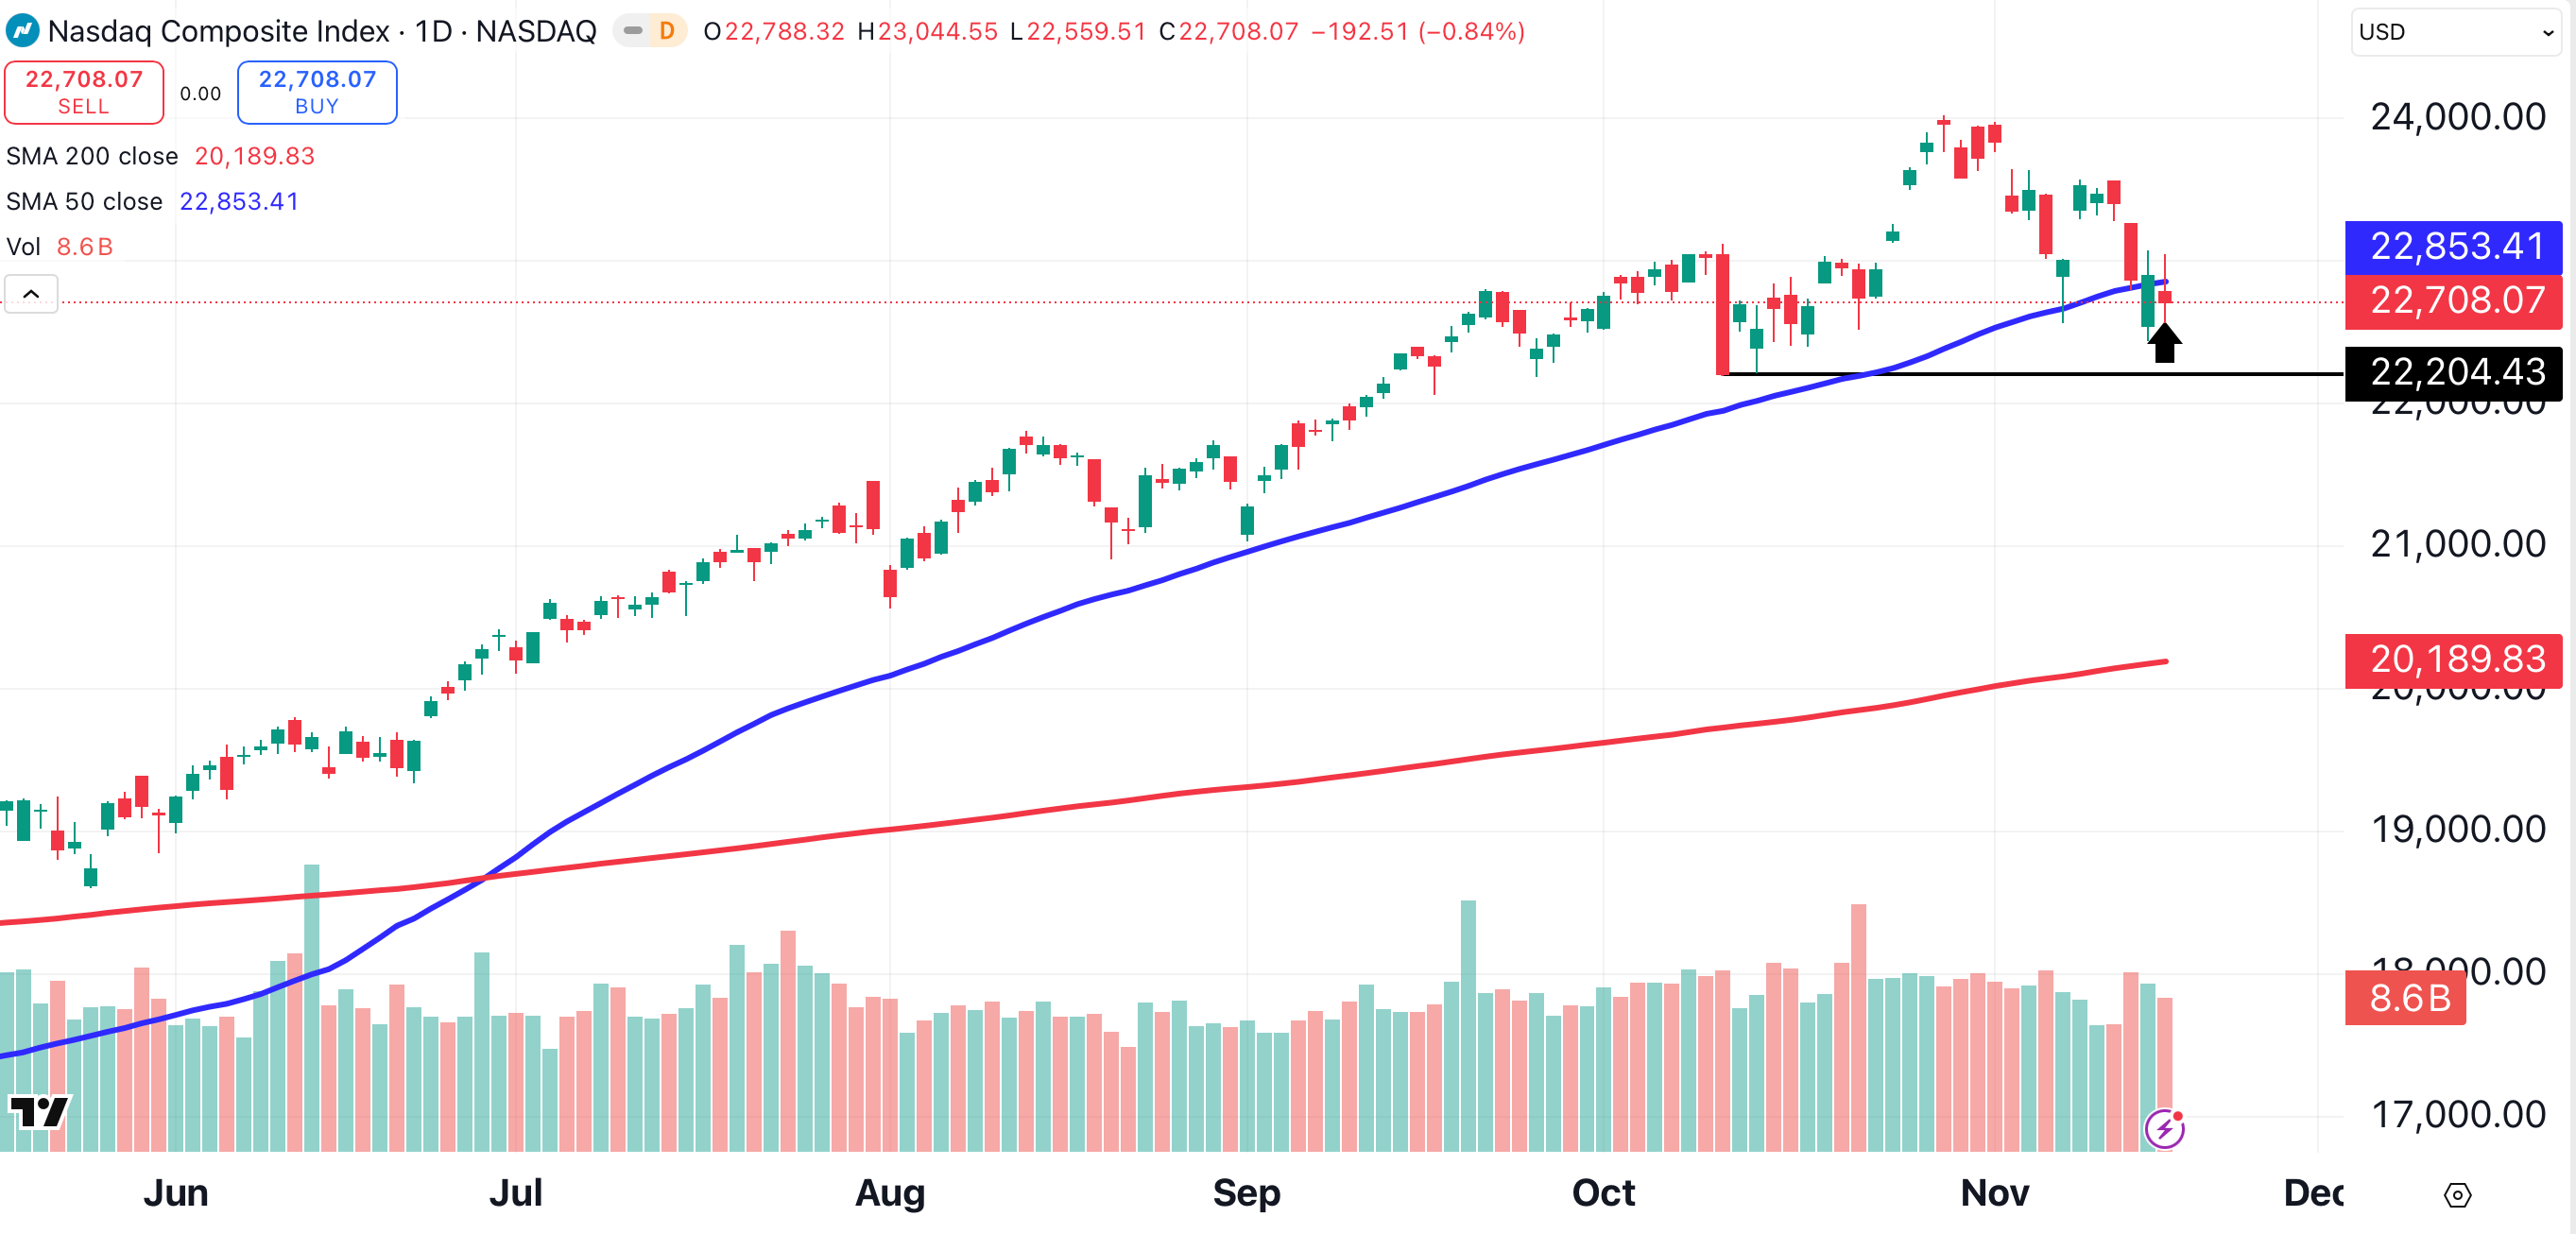
Like the S&P 500, the Nasdaq Composite also lost nearly 1%. The tech-laden index closed beneath (arrow) its 50-day moving average (blue) for the first time in six months on Monday.
On this chart, the October 10 low (black solid line) provides the next level of support, at 22,204. Traders will be watching to see if that level holds, and if the Nasdaq Composite can climb back above the 50-day MA, currently located near 22,850.
3. Nvidia
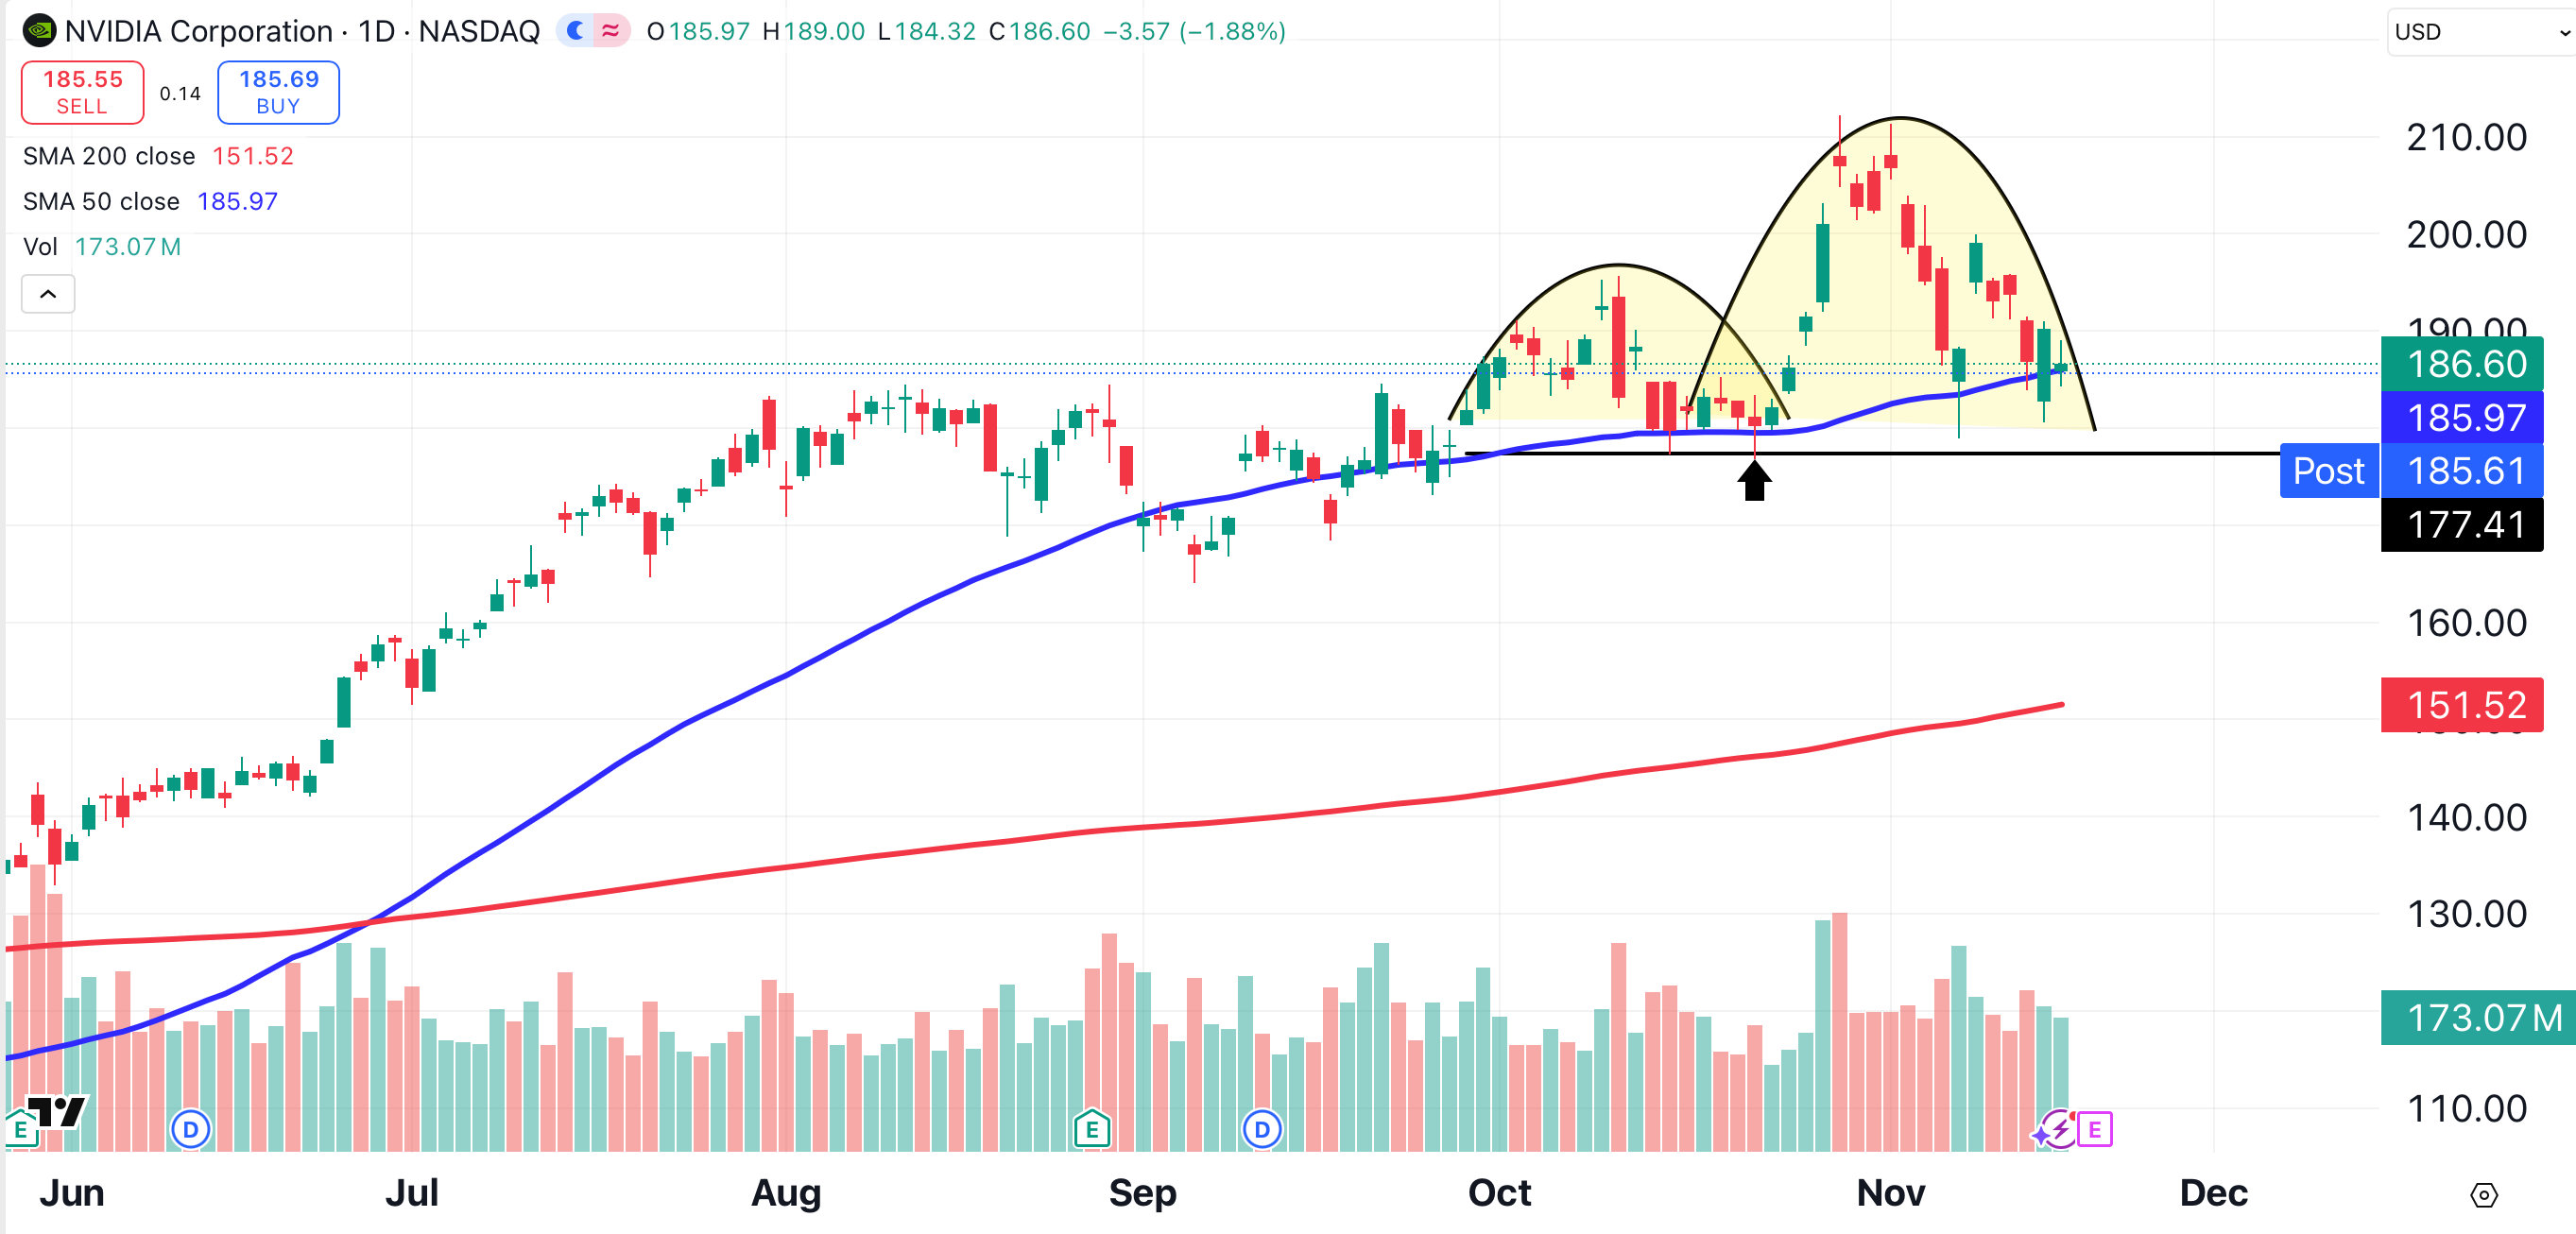
Nvidia is scheduled to report earnings after the close on Wednesday. After closing at an all-time high just three weeks ago, Nvidia is testing support (black horizontal line) near $177. That figure represents the October 22 low (arrow).
Nvidia could be in the early stages of forming a head-and-shoulders pattern. The left shoulder and head are visible (shaded yellow), but it remains to be seen if the formation will be completed. If $177 breaks, we could see Nvidia slide to its 200-day moving average (red), currently near $151.
The Big Event
Nvidia’s earnings report could create volatility on Thursday morning, since it’s the largest component in both the S&P 500 and the Nasdaq Composite. Volatility could also increase one hour before Thursday’s opening bell, when the non-farm payroll employment report for September is scheduled for release.
The report, which was delayed due to the recently-ended U.S. government shutdown, is usually released on the first Friday of the month. The median estimate calls for about 50,000 jobs created in September, up from about 22,000 in August.
The unemployment rate is expected to remain steady at 4.3%. Any wide variations from the September estimates, or major revisions to the August figure, could cause a spike in volatility.
At the time of publication, Ponsi was long NVDA.
