Crashes Are Outliers. What the Indicators Are Telling Us Now.
Let's look at the indicators to see what's next: more pain or a bounce.
You've reached your free article limit
You've read 0 of 1 free Pro articles.
There is a lot of talk about a Black Monday event. I think crashes are outliers, just like meltups are, but somehow it never seems to stop all these market gurus from calling for them.
I lived through the 1987 Crash. It was scary as hell so I really do wish everyone would stop calling for a Crash. It always looks so neat and tidy on the chart after the fact, but I can promise you it is anything but when you are living through it. Also, we have circuit breakers in place now, so it’s hard to imagine one day with a 20%+ decline.
Can we keep going down on Monday? Sure. But let’s first talk about what transpired on Friday.
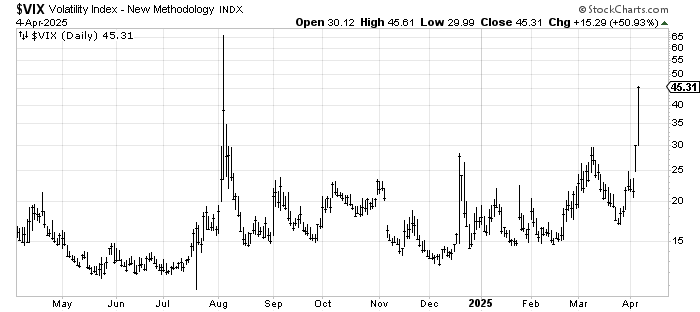
On Friday, we finally saw the VIX get jumpy. It blasted through 30 and looks like the kind of chart a momentum trader would embrace. Can it go higher? Absolutely, but the look is now jumpy.
We finally saw over 90% of the volume on the downside, something we haven’t seen since December 18th. I believe that is because we finally saw selling in the Utes, the REITs, the drugs, the staples, the non-US markets, and so forth. In other words, the hidey holes were taken to the woodshed. A plus.
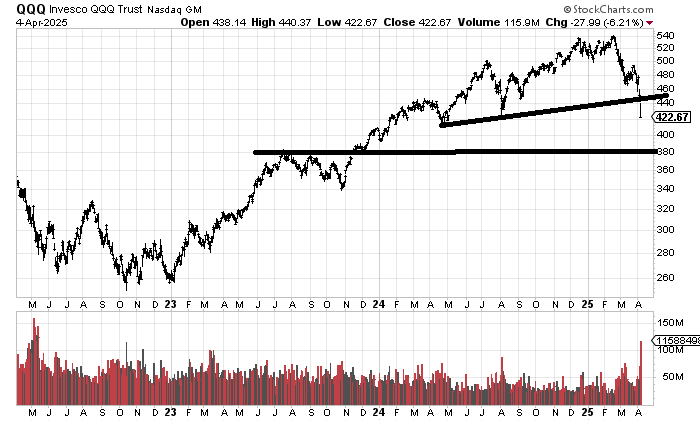
Volume surged. And this time, it surged without all those penny stocks being the reason. The QQQs saw over 100 million shares traded. That is the first time since October 2022 and before that May of 2022.
We saw the number of stocks making new lows surge to readings I’d call off the charts. The NYSE, which typically sees around 2800 issues traded each day, had 1042 new lows. That’s nearly forty percent of the stocks that trade there that made new lows. I’d call that panicky.
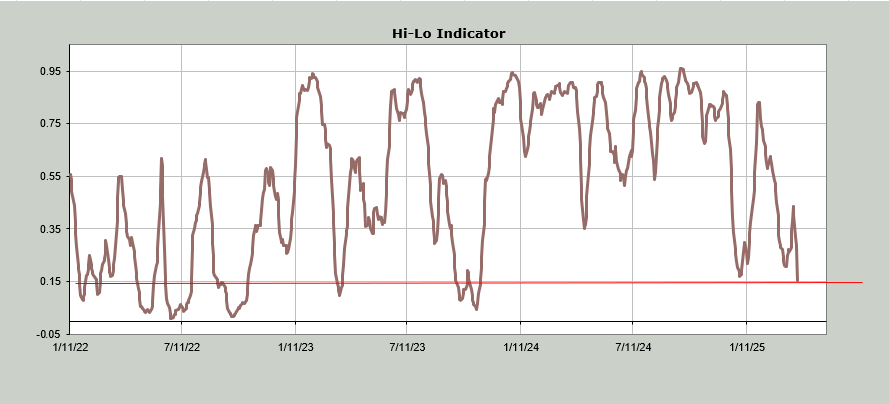
The good news is that the NYSE Hi-Lo Index is now at .15. Under .15, and it finally gets oversold. Even if the market rallies on Monday, this indicator is likely to go lower in the next few days, thus taking it to an oversold condition. That’s the math.
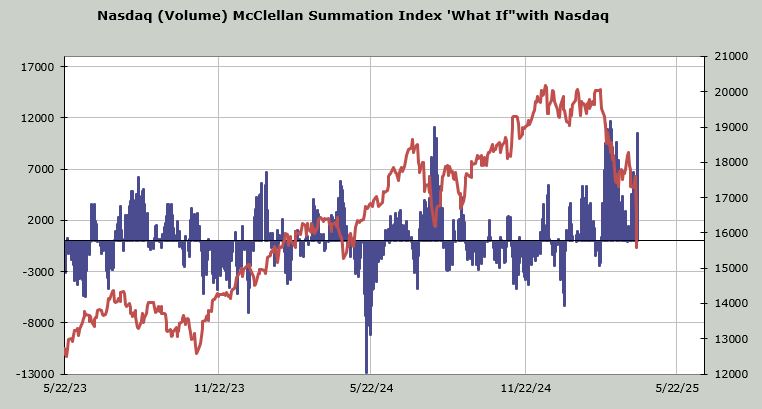
While the McClellan Summation Indexes are all still falling and the NYSE only needs a net differential of +2900 advancers minus decliners to halt the slide (+4000 is oversold), Nasdaq’s, where I use volume is nearly at the early March level of +11 billion shares (up minus down volume). That’s oversold.
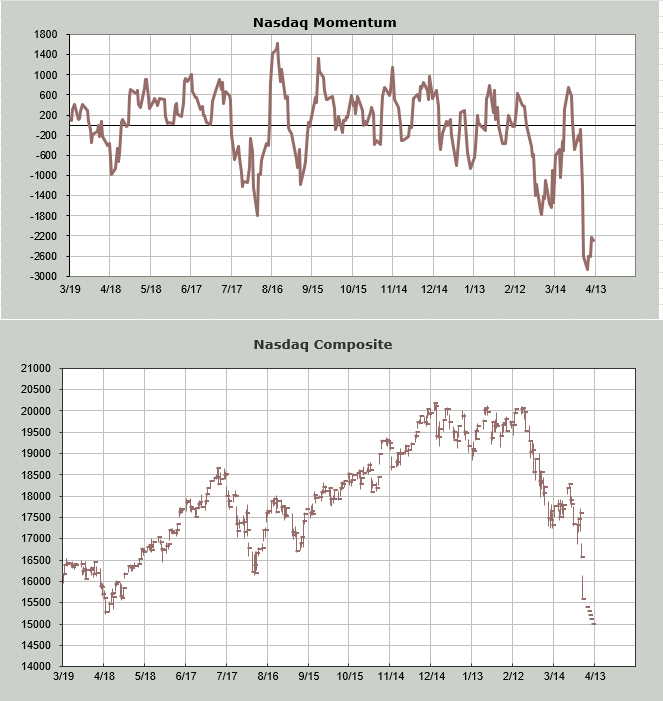
Nasdaq’s Momentum Indicator, where I plug in lower closes over the next week to see when it stops falling and turns up, turns up on Tuesday. Keep in mind this is not about the exact day but the general time frame and that is early this week.
Friday’s put/Call ratio was 1.18 so that makes it two days of readings over 1.15. I would have liked to see the equity put/call ratio higher on Friday (it was .64), but it was 1.02 on Thursday. The ten-day moving averages are not extreme.
The Daily Sentiment Index (DSI) for Nasdaq is at 9, and the S&P is at 10. Single digits are where the red light flashes.
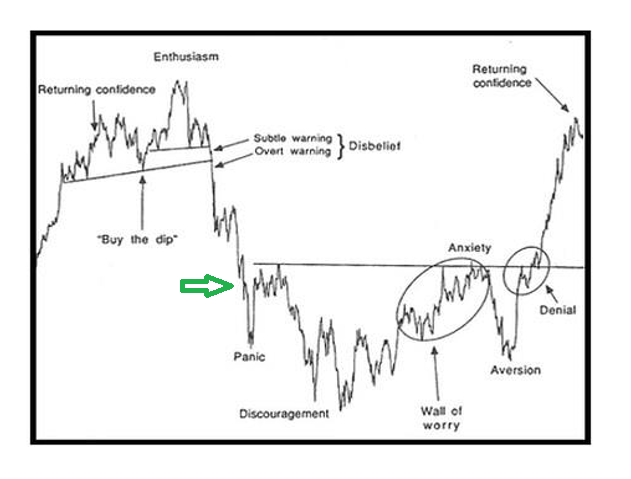
Finally, an update on where I believe we are on the chart of the Sentiment Cycle. I have been of the mind that we were in that little area just to the right of the words ‘buy the dip.’ I now think we are into that slide to Panic. So, we are either near that green arrow and a down Monday would take us to Panic, or we are already there.
Notice that we tend to get a decent rally off that Panic level, but after that, we tend to go back down again.