Could Money Be Flowing Into European Stocks?
The key US indices show declining highs in their latest rallies. Meanwhile, Europe has surprising strength.
You've reached your free article limit
You've read 0 of 1 free Pro articles.
You can see how very little anyone wants to do in the market. After weeks of non-stop hysteria, we finally had a very calm day. Or at least it was somewhat calm as the volume has returned to pre-Liberation Day levels. In fact, Nasdaq had the lowest volume since March 28th.
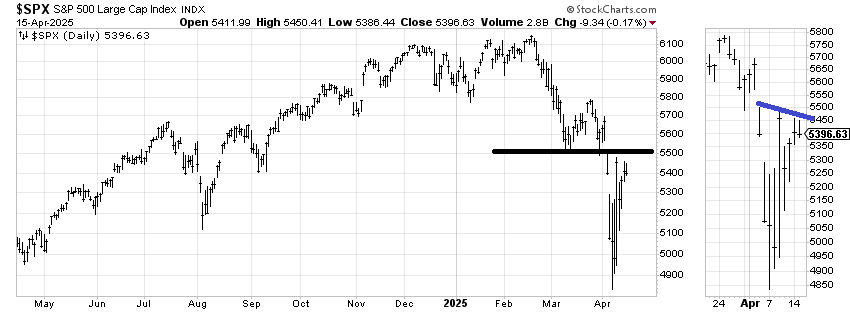
So, we may have quieted down the volume and the volatility for now, but the resistance is worth looking at. Let’s start with the S&P. The left-hand panel shows the resistance at 5500. The right-hand panel magnifies the last few weeks, where we have seen lower highs (blue line). Each rally has found sellers just a smidge lower, notably since last Wednesday’s big turnaround.
I kept thinking the QQQs could get to 470 and fill that gap, but even the QQQs can’t get back to last week’s high. It’s like one of those cartoons where every time the character lifts his head, someone is there to bop him on it.
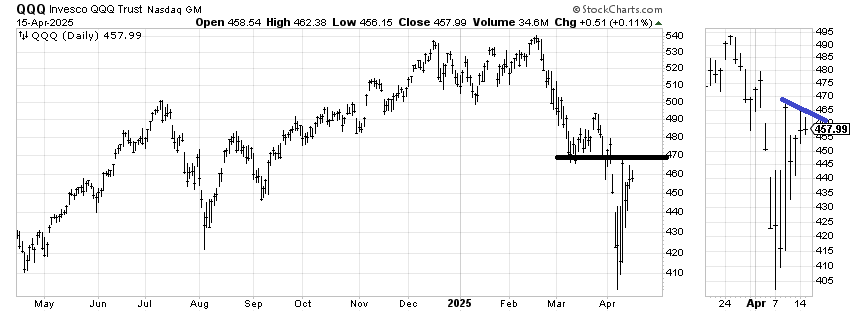
But what I want you to look at is the rally off the August low. Can you see how different that looks than this? Once that got going, it kept going for two weeks. We are currently a week into the rally, and still, we have lower highs.
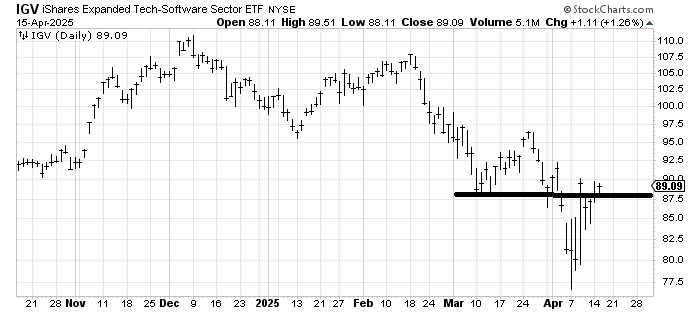
I thought IGV, an ETF to be long software stocks, had done well because it had gotten into resistance last Wednesday. But look at the action this week: it still can’t get over last Wednesday’s high. This chart has the best chance of eating through the resistance because, unlike all the other tech charts, it did not make a lower low, but thus far, the rebound has been lacking.
As I noted yesterday, we’re in that period of time where there is a lot of ‘should I or shouldn’t I?’ and that doesn’t seem poised to change yet.
So why was August different? Notice we came off the July high abruptly, right from a new, fresh high. This time, we had been shuffling about between 5800-6100 on the S&P since November. That means there is more resistance overhead this time.
In the meantime, the Russell 2000 had its third straight green day, something it hasn’t done since January. I admit it was pretty lethargic, but it was a small change in the pattern.
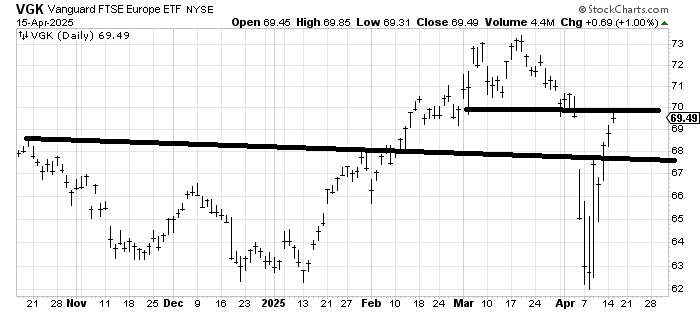
We’ll look at one final chart: VGK. It is an ETF to be long Europe. It has filled the gap (thus is at resistance), but notice that it has rebounded much better than its US counterparts. Notice that it is now higher than last Wednesday’s rebound. Notice that, unlike the US indexes, it did not spend the months prior to the big decline going sideways but up. I think it pulls back to that lower line, and if it can hold there, it would be bullish.