Charting Bitcoin's 'Uh Oh!' Move, Why I'm Bullish on December
Let's look at what's up (er, down) with the crypto and the gold bet; also, my take on the season to be jolly, earnings ahead.
You've reached your free article limit
You've read 0 of 1 free Pro articles.
For Those About to Rock
Stand up and be counted
For what you are about to receive
We are the dealers
We'll give you everything you need
Hail, hail to the good times'
Cause rock has got the right of way
We ain't no legend, ain't no cause
We're just livin' for today
For those about to rock, we salute you
For those about to rock, we salute you
- Johnson, A. Young, M. Young (AC/DC), 1981
Stumbling into Monday?
U.S. equity index futures slipped well below fair value late Sunday into early Monday as November melted into December. Is this new bout of weakness somehow meaningful? Is this just some profit-taking after a heck of a late November run had put the major indexes back within sight of their all-time highs? There was a rotation of sorts that lasted nearly the entire month. Does that rotation unwind? Will that rotation reassert itself?
While risk assets such as cryptocurrencies are trading seriously lower this morning, giving back much of the ground recovered late in November, crude oil continues to rally. True safe haven, inflation- hedging type assets such as gold continue to reach for the sky. Physical gold has nearly completed what would be a bullish cup pattern. No way to know just yet, if a handle will be added to that cup. A handle just might be the last opportunity to add at these levels. Yes, I am a "gold" guy and mildly biased.
Bitcoin, for that matter, continues to find difficulty in recovering after developing a bearish Double Top pattern over the second half of the summer. The world's best-known cryptocurrency then broke lower from a Falling Wedge pattern, which is supposed to be a pattern of bullish reversal. Uh oh.
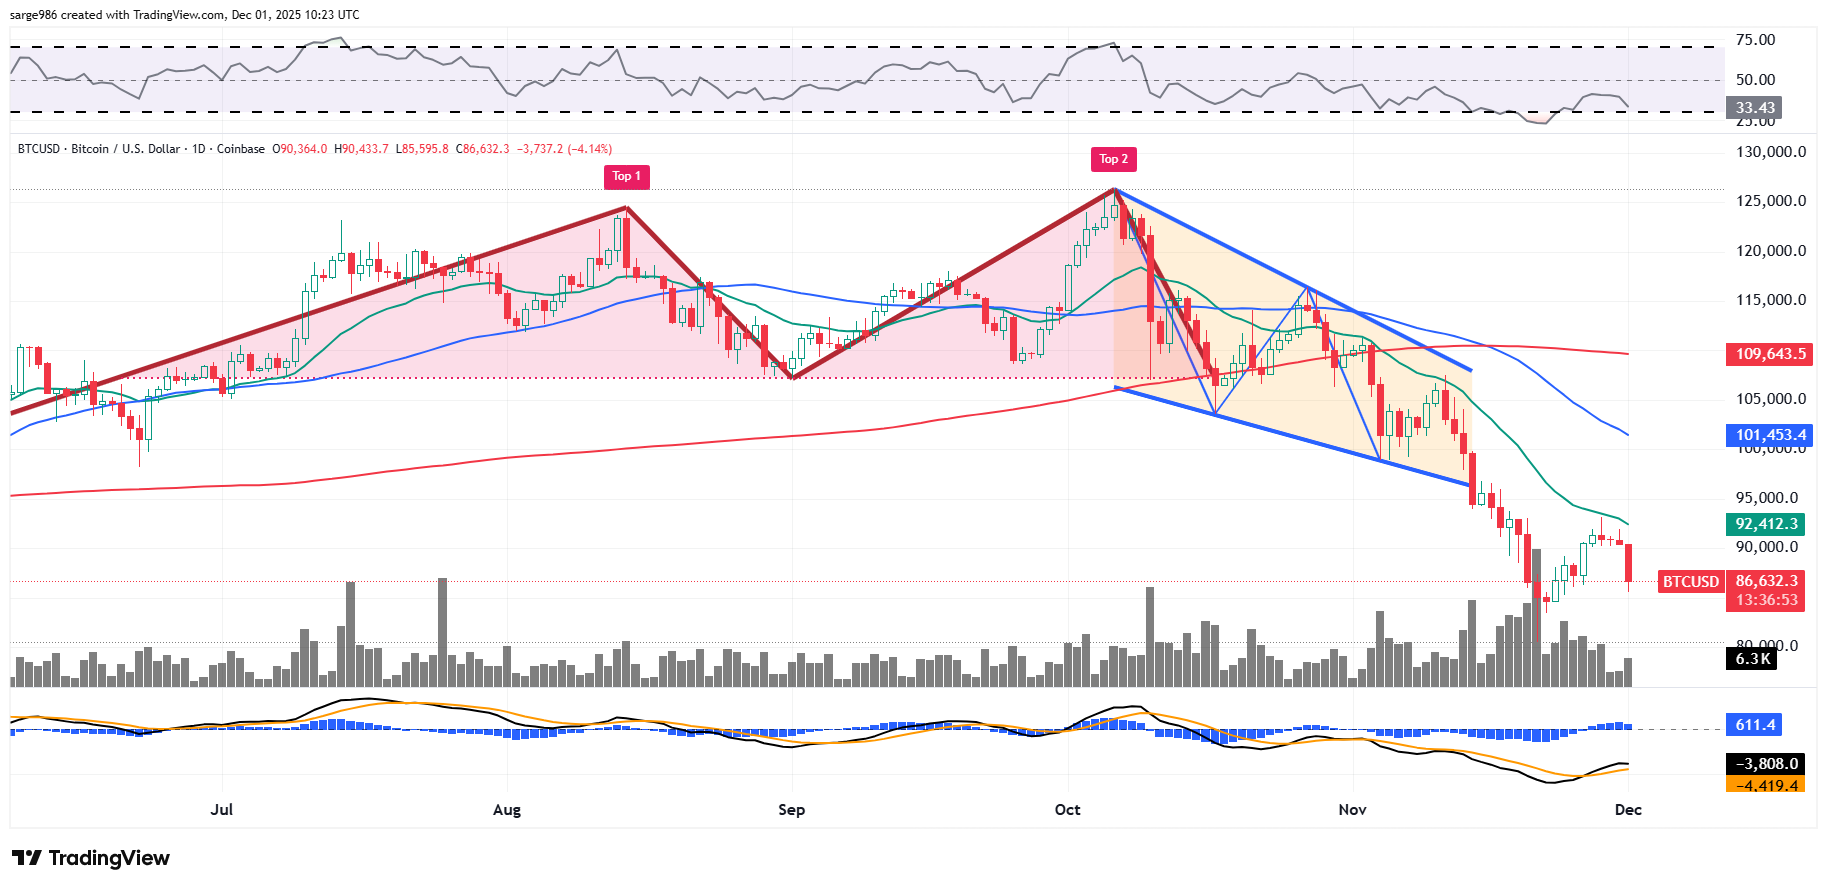
Just how negative is this? That's not an easy question to answer. Bitcoin has clearly tried to establish support in the low- to mid- $80,000s. Yet, the token has just as clearly hit resistance at its 21-day exponential moving average. This would suggest rejection by the swing crowd.
What's really cooking? Why are cryptos under pressure? Why are equity index futures struggling this morning? I think it quite obvious that both the threat of war and the threat of peace are having an impact. How paradoxical is that? As U.S. forces posture aggressively in the Caribbean, markets react to the realistic possibility of an imminent confrontation with the Venezuelan military. At the same time, though both sides are still throwing haymakers, it appears that Russia is running out of the financial resources it needs to continue a war of aggression, while Ukraine's armed forces are just plain running out of soldiers.
War Games
No, it's not easy to piece this puzzle together. While kinetic warfare in the Americas will force some investors into safe haven assets such as gold, U.S. Treasuries remain focused on the Fed, which has moved into their media blackout period ahead of the Sept. 10th policy decision. The short end of the slope of the yield curve remains suppressed, while the long end reflects some overnight selling. Japanese sovereigns, usually also a safe-haven asset, have come under intense pressure.
What about Bitcoin and other cryptos though? Will U.S. enforcement of Monroe Doctrine-style diplomacy result in a decrease in the use of cryptos for drug-related illicit purposes? Possibly. Will the possibility of a peace agreement in eastern Europe result in increased usage of the Russian ruble as that nation tries to rejoin the community of nations? Also, probably. That would depress demand for cryptocurrencies. So would a reduction in the need to launder fiat currency through cryptocurrencies in both Russia and Ukraine as war-related corruption subsides.
It's impossible to truly tell from afar, just how deeply these forces impacted demand for cryptocurrencies, so I don't know if recent support is solid support. That said, it would appear that the conditions that supported increased demand for cryptocurrencies during the 2020s are at serious risk of unwinding to a more significant degree than some might expect. Then again, maybe I'm just a punk kid from Queens. Bitcoin, by the way, traded with a $16,000 handle as recently as late 2022, the year that Russian forces invaded Ukraine.
Assessing Last Month and Week ...
Equity markets rallied for a fifth consecutive session on Friday, which was a half-day. Trading volume contracted on a day-over-day basis for every session of the holiday-impacted week. Though positive, that does make the results a little wonky. Hence, we changed up this section this week to try to make the numbers a bit more meaningful.
- The S&P 500 gained 0.54% on Friday and is up 4.75% over the past five trading sessions. The S&P 500 is up 16.45% year to date.
- The Nasdaq Composite gained 0.65% on Friday and is up 5.83% over the past five trading sessions. The Nasdaq Composite is up 21% year to date.
- The Nasdaq 100 gained 0.78% on Friday and is up 5.74% over the past five trading sessions. The Nasdaq 100 is up 21.05% year to date.
- The Russell 2000 gained 0.58% on Friday and is up 8.47% over the past five trading sessions. The Russell 2000 is up 12.12% year to date.
- The S&P Smallcap 600 gained 0.11% on Friday and is up 7.82% over the past five trading sessions. The S&P 600 is up 4.51% year to date.
- The S&P Midcap 400 gained 0.45% and is up 6.39% over the past five trading sessions. The S&P 400 is up 6.01% year to date.
- The Dow Transports gained 0.33% on Friday and is up 6.83% over the past five trading sessions. The Dow Transports are up 4.34% year to date.
- The Philly Semis gained 1.82% on Friday and is up 10.6% over the past five trading sessions. The Philadelphia Semiconductors are up 41.07% year to date.
- The KBW Bank Index gained 0.66% on Friday and is up 5.58% over the past five trading sessions. The KBW Banks are up 20.92% year to date.
S&P Sector SPDR ETF Performance
- Consumer Discretionaries (XLY) were up 4.86% last week, but down 1.94% for November. The Discretionaries are up 6.1% year to date.
- Technology (XLK) was up 4.77% last week, but down 5.21% for November. Technology is up 23.67% year to date.
- Materials (XLB) were up 3.53% last week, but just 0.35% for November. The Materials are up 7.81% year to date.
- Financials (XLF) were up 3.21% last week, but just 0.64% for November. The Financials are up 11.49% year to date.
- Communication Services (XLC) were up 3.12% last week, but down 1.02% for November. Communication Services are up 20.25% year to date.
- Utilities (XLU) were up 2.81% last week, but just 0.55% for November. The Utilities are up 22.24% year to date.
- Industrials (XLI) were up 2.71% last week, but down 0.64% for November. The Industrials are up 17.84% year to date.
- Health Care (XLV) was up 1.97% last week, and up 8.39% for November. Health Care is up 16.12% year to date.
- Consumer Staples (XLP) were up 1.89% last week, but just 1.2% for November. The Staples are up 2.9% year to date.
- Real Estate (XLRE) was up 1.88% last week, but down 0.29% for November. The REITs are up 4.84% year to date.
- Energy (XLE) was up 1.15% last week, and up 3.54% for November. Energy is up 8.2% year to date.
The Charts...
Readers will see that the S&P 500 regained its 21-day exponential moving average, 50-day simple moving average and the lower trendline of our Raff Regression model during the holiday-shortened week.
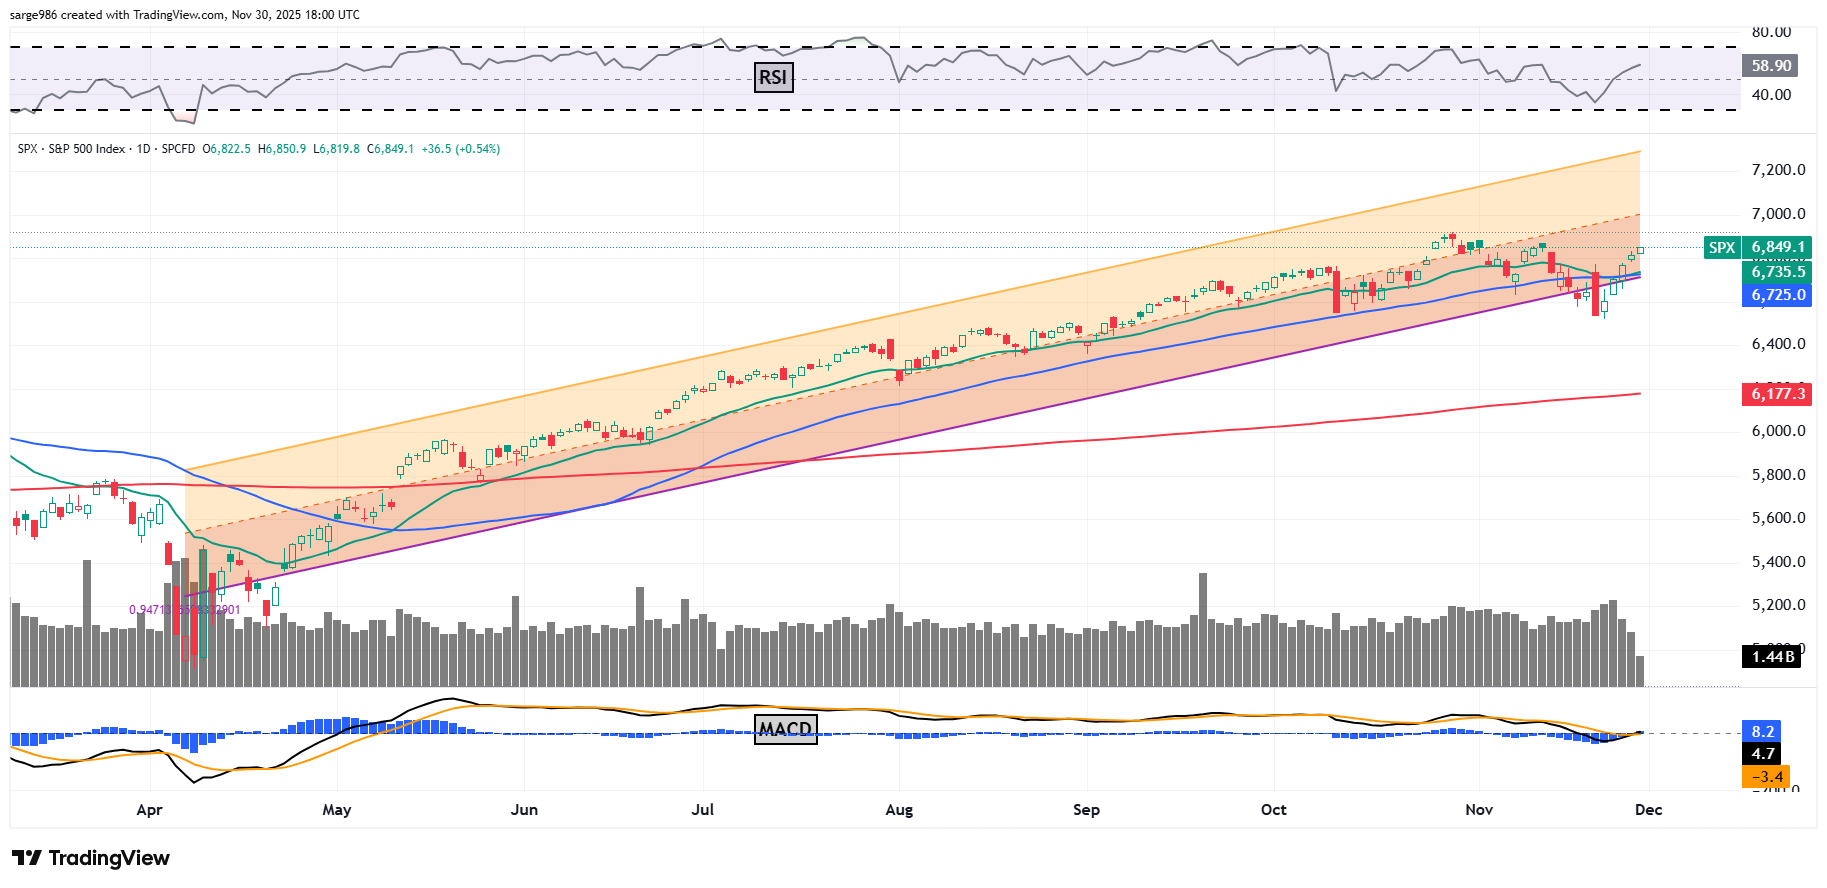
This would be incredibly constructive technically if not for the three consecutive sessions of contracting day over day trading volume. That does not "undo" all of the positivity, it just makes us less certain.
I was bullish going into November. I had to adjust a few positions as certain levels were met, but to be clear, I remain bullish for December and, in fact, see a positive environment for risk assets well into the new year. That does not account, obviously for geo-political risk, but lower short-term rates, reduced tax burdens and fewer regulatory obstacles for growing businesses are not negatives for stakeholders.
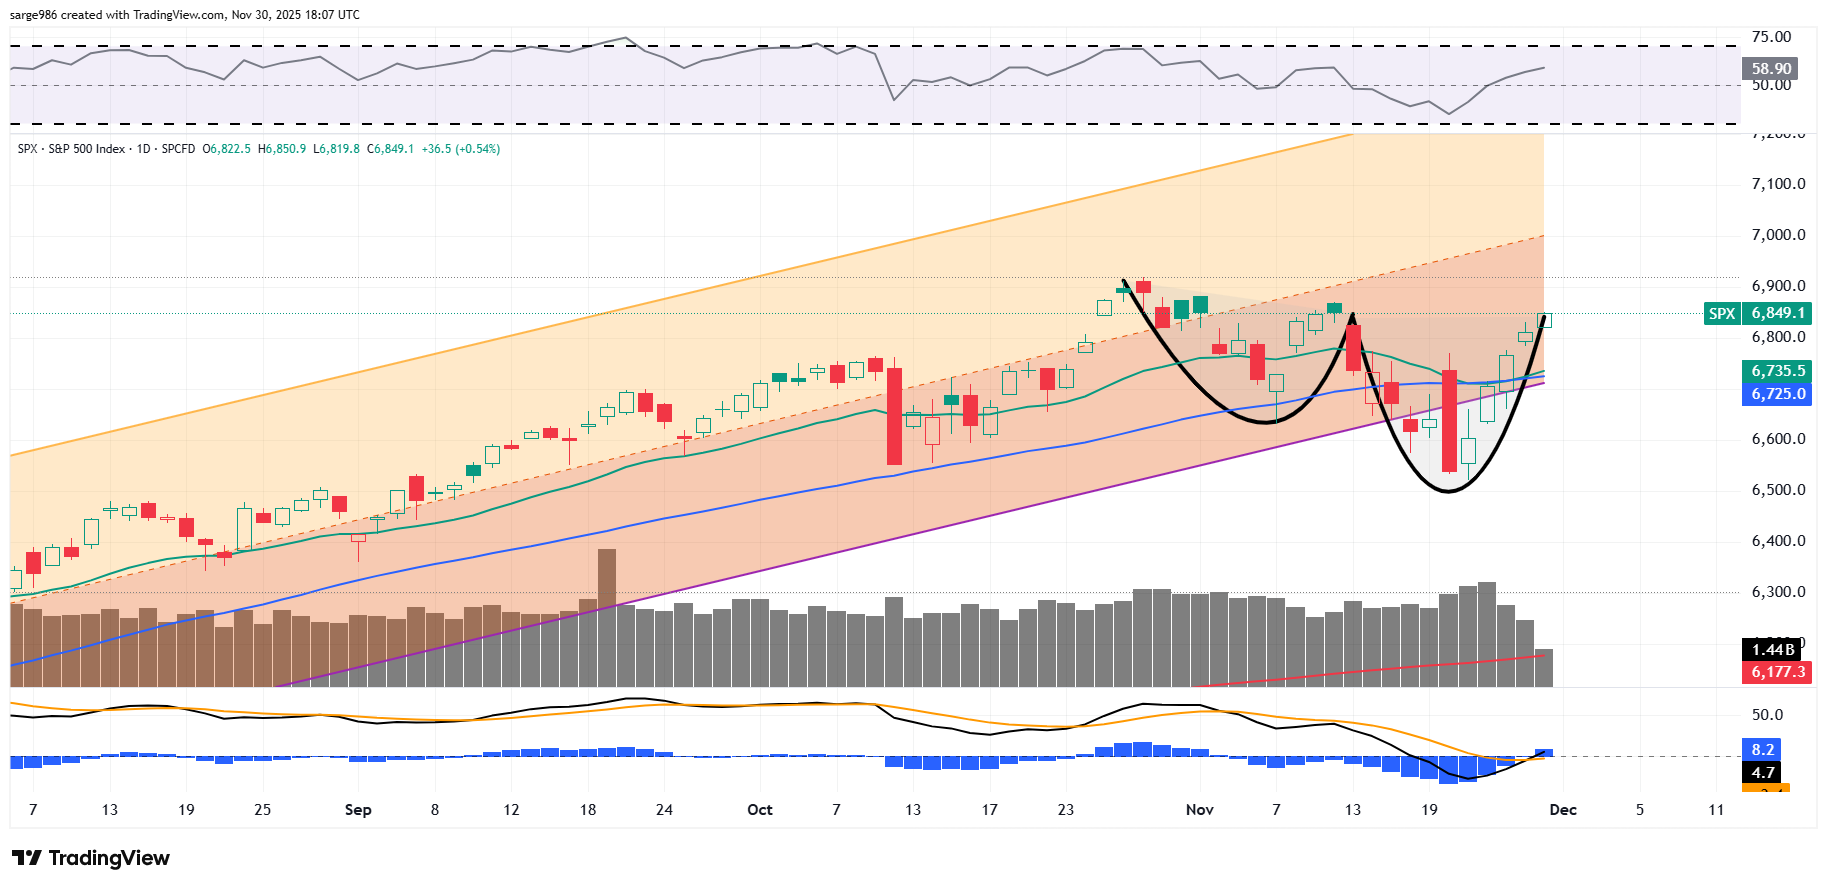
Do you see two-thirds of an Inverted Head & Shoulders pattern? If you do, that's a bullish pattern that will offer us one more dip buying opportunity.
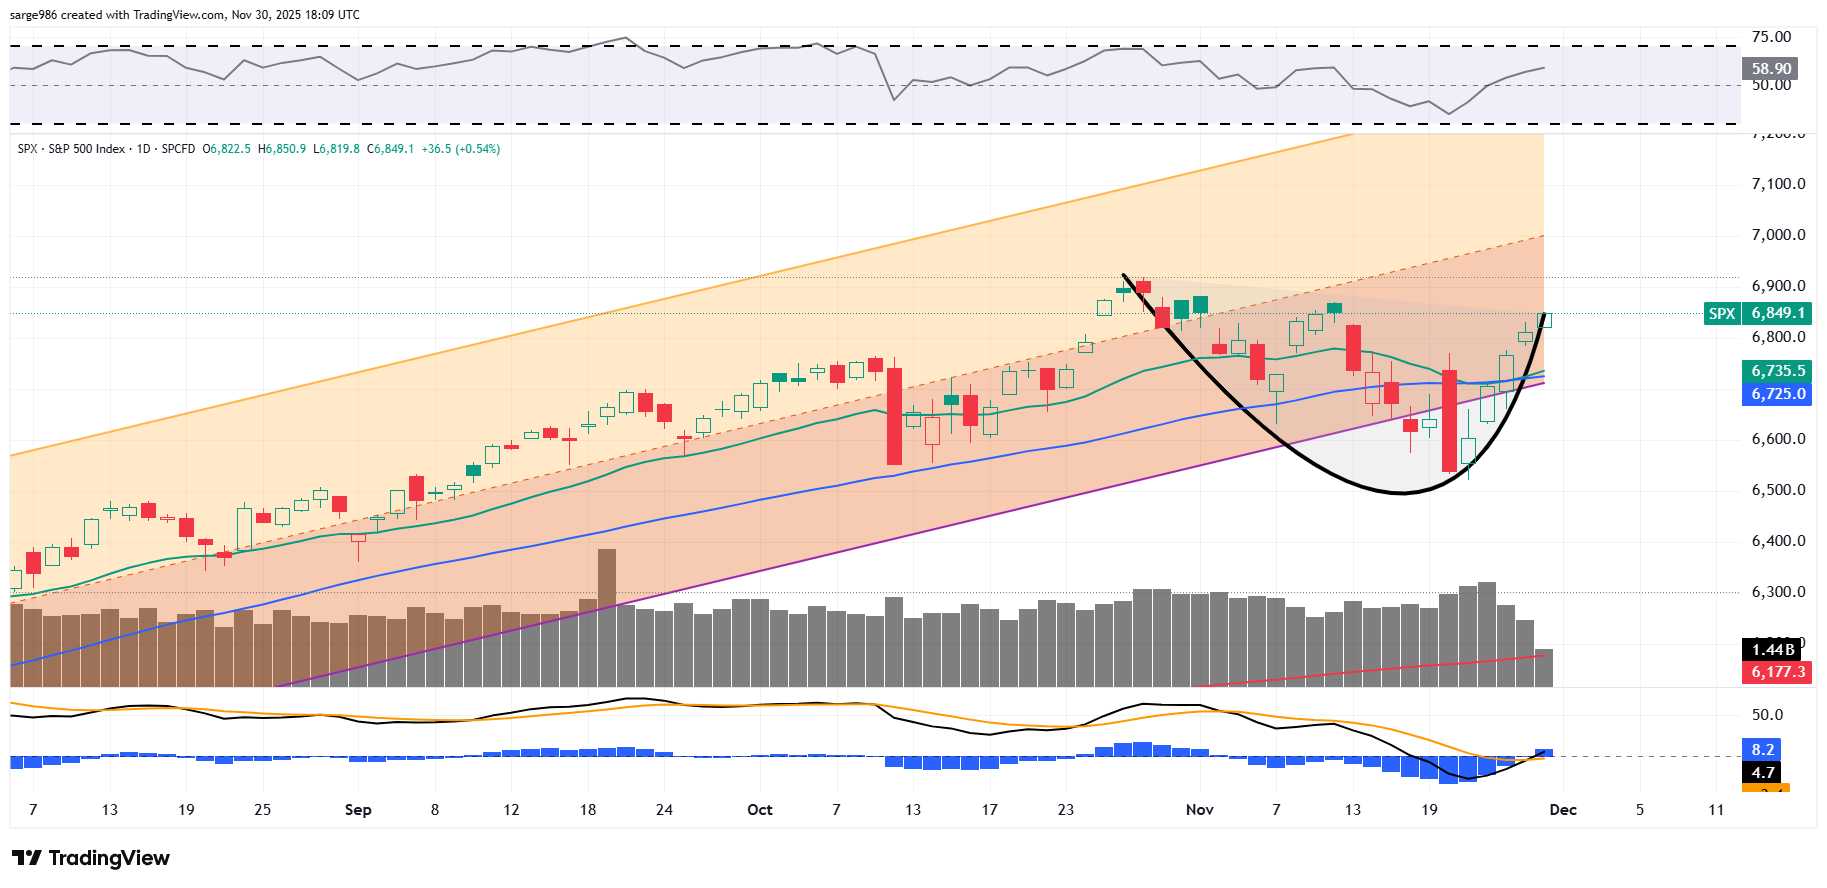
Do you see an "in-progress" Cup pattern? If the pattern develops a handle, that too would be a bullish pattern that will offer us one more dip buying opportunity. Food for thought.
As far as the indicators are concerned, Relative Strength has moved out of neutral territory and worked its way toward something more bullish than that. Below the chart, readers will see a suddenly more bullish daily Moving Average Convergence Divergence. Within that indicator, the histogram of the 9-day EMA has crossed back into positive territory, which is short-term bullish. On top of that, the 12-day EMA has crossed above the 26-day EMA (bullish) and into positive territory itself (also bullish). If traders can move that 26-day line into positive territory, we may have a holiday season party after all.
Earnings
FactSet did not publish an "Earnings Insight" report during the holiday-shortened week. As of Nov. 21, according to FactSet, for the third quarter, with 95% of the S&P 500 having reported, 83% of those companies had pleasantly surprised on earnings (up from the week prior), while 76% of those companies (in line with the week prior) had surprised in the right direction on the generation of revenue.
The impressive performance this earnings season and increased guidance in general, has boosted the blend of third-quarter earnings results / expectations for the S&P 500 all the way to growth of 13.4% from 10.7% several weeks ago and from just 8% at the start of the reporting season.
Blended third-quarter revenue growth expectations now stand at 8.4%, up from 6.3% several weeks ago. For the full calendar year of 2025, Wall Street now sees S&P 500 earnings growth at 11.8% (up from 11.7%) on revenue growth of 6.8%, which is in line with the two weeks prior.
Back to the quarter, technology, the financials, the utilities and the materials have all been outperformers with blended earning growth of 20% or more. Just two sectors are still running at a year over year earnings contraction led to the downside by communication services.
Valuation
According to Dow Jones Market Data and data provided to Dow Jones by Birinyi Associates, the S&P 500 ended last week trading at 22.09-times 12 months' forward-looking earnings, and 25.255-times trailing 12 months' earnings. That number is up slightly from 25.15-times one year-ago for the same weekend.
Broadening our look here, using the same sources, the Nasdaq 100 went into the weekend trading at 25.97-times forward looking and 33.37-times trailing earnings. That is up from 32.26-times one-year ago. The Russell 2000 closed on Friday at 22.49-times forward looking earnings and 35.63-times trailing earnings. This is down from 35.96-times one year ago.
Clearly claims of an overvalued marketplace, while possibly valid, are not a new or even new-ish condition. Trailing earnings-focused valuations are in line and in some cases even lower than where they were a year ago.
The GDP Game
Last week, the Atlanta Fed revised its GDPNow model for the third quarter down to 3.9% from growth of 4.0% (q/q, SAAR). Among other regional central bank district branches running close to real-time GDP models, the New York Fed's estimate for Q3 growth was left unrevised at growth of 2.31%. The Cleveland Fed's model for the third quarter was also left unrevised at growth of 2.05%. Finally, the St. Louis Fed model has been revised lower, to growth of 0.47% from 0.59% the last time I looked, which admittedly was two weeks ago.
Hedgeye's model, which is something that I pay for, and in my opinion, has historically been among the most accurate models I can find, is currently for Q3 GDP growth of 3.46%. If one throws out the outlier, which is St. Louis, the third quarter is still, even damaged by the government shutdown, looking like a better than decent quarter in terms of economic activity.
Fed Funds Futures
Fed Funds futures trading in Chicago are now pricing in just an 86% probability for a quarter-point rate cut on Dec. 10, up from something close to 45%, a couple of weeks ago. This has helped provoke the recent risk-on activity across financial markets. At present, there is now a half-percentage point worth of additional rate cuts fully priced in (78% chance) for all of calendar 2026. These markets are also pricing in another rate cut for early 2027.
On the Docket...
As we are now more or less, in between reporting seasons, there are not a lot of earnings releases scheduled for this week. That said, within the group of publicly traded corporations expected to report, there are some well known tech stocks and well-known retailers. The macroeconomic data has gone into "catch-up" mode, so we may see more than I see on my radar as I type out this Monday morning piece. As for the Fed, that group has entered into their media blackout period ahead of the Dec. 10 policy decision.
.... As just mentioned, The Fed has gone into its "eight times a year" quiet period. You may see that Fed Chair Jerome Powell is set to speak publicly this afternoon and that there are two public appearances to be made by Fed Gov. Michelle Bowman on the week's schedule. Members of the Federal Open Market Committee can still speak publicly. They may not speak on their ideas for monetary policy on a forward-looking basis.
.... The macroeconomic calendar could get busy this week. I see the ISM Manufacturing Index for November set for release later this morning and the ISM Non-Manufacturing (Services) Index set for Wednesday Morning. ADP will release its monthly report for private sector job creation for November on Wednesday morning as well. September Industrial Production is also due Wednesday. We'll also see data covering September Personal Consumption Expenditure prices and September Personal Income & Spending this Friday morning. As for reports that could sneak up on traders, look for the Challenger print for November job-cut announcements on Thursday morning and the University of Michigan's preliminary survey results on Friday covering December consumer sentiment and December inflation expectations.
.... The earnings calendar will produce some well-known names this week. This evening, we'll hear from MongoDB (MDB) . On Tuesday, CrowdStrike (CRWD) , Marvell Technology (MRVL) and Okta (OKTA) will report after the closing bell. Ahead of the opening bell on Wednesday, Dollar Tree (DLTR) and Macy's (M) will go to the tape. They will be followed by Salesforce (CRM) , and Snowflake (SNOW) that afternoon. Thursday will be active as Dollar General (DG) , and Kroger (KR) report in the morning and then DocuSign (DOCU) and Ulta Beauty (ULTA) report after the close. Victoria's Secret (VSCO) will release their numbers on Friday morning.
.... Other corporate events set for this week will include Amazon's (AMZN) annual cloud conference today in Las Vegas. On Tuesday, Nvidia (NVDA) will demonstrate a number of the firm's high-end and conceptual products at the 2025 NeurIPS conference. Additionally, on Tuesday, expect to see the National Retail Federation's Thanksgiving weekend shopping results.
Economics
(All Times Eastern)
09:45 - S&P Global Manufacturing PMI (Nov-F): Flashed 51.9.
10:00 - ISM Manufacturing Index (Nov): Expecting 48.8, Last 48.7.
The Fed
(All Times Eastern)
Fed Blackout Period.
Today's Earnings Highlights
(Consensus EPS Expectations)
After the Close: (MDB) (.79)
At the time of publication, Guilfoyle was long CRWD, NVDA equity. Long physical gold.
