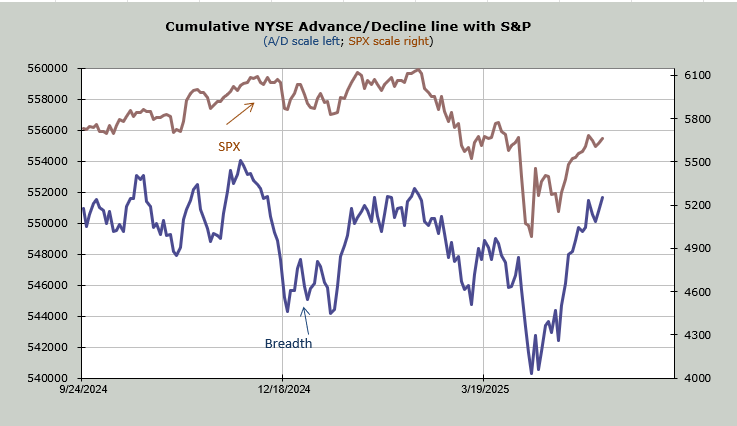
Breadth Has Begun to Outperform the S&P 500
Let's dig in to see how good a sign that might be.
You've reached your free article limit
You've read 0 of 1 free Pro articles.
We have a deal! No wait, maybe it’s not a deal.
We have the S&P over 5700. No wait, maybe we can’t hold on to 5700.
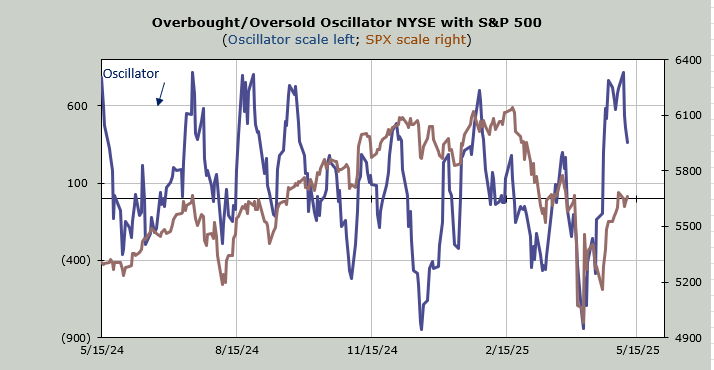
I could go on, but the bottom line is the market has been a chop fest all week. We were down pretty good on Tuesday, only to rally late in the day. We were up pretty good on Thursday, only to sell off late in the day. To me, that’s the market working off the short-term overbought condition. Maybe Friday will change that, but I still think once the market works through this, we should rally again.
The reason is the intermediate-term indicators are not yet overbought. My expectation is they will be overbought the week before Memorial Day. As that time draws near, we take a look at the other indicators to see if they are rolling over or not.
Thus far, breadth has been excellent. I know I show this chart often, but look at the blue line (breadth) and see how it is outperforming the S&P (brown). Notice that the high in February saw the blue line at a lower high while the S&P made a higher high. That is not the case now.
The McClellan Summation Index is still rising and has a decent cushion should we pull back. Those go on the positive side of the ledger.
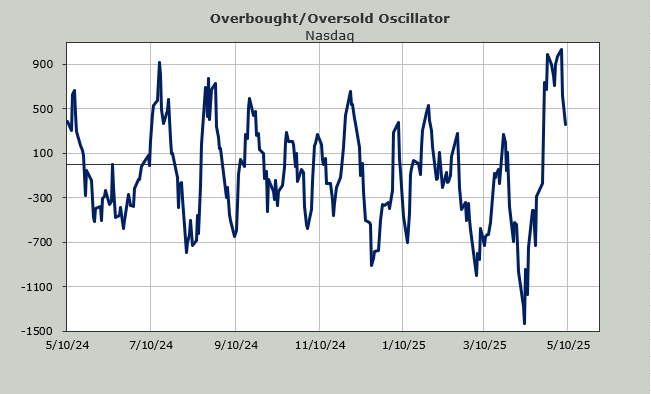
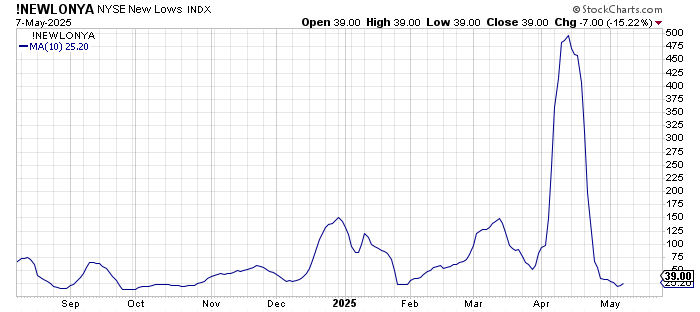
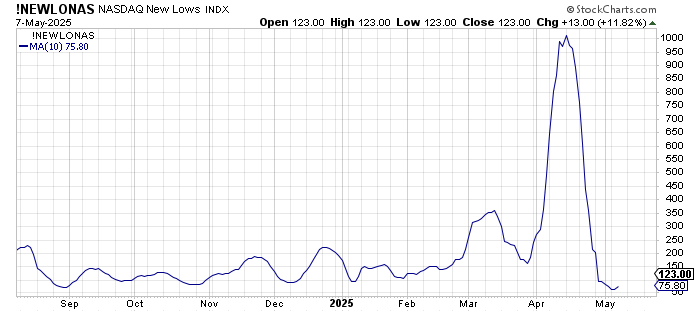
The number of stocks making new highs and lows are starting to waver, though. We’ve discussed the Nasdaq Hi-Lo Indicator, which rolled over this week, and for the third straight day Nasdaq had more new lows than highs. On Thursday, the NYSE Hi-Lo Indicator stopped going up. It didn’t roll over, though.
The ten-day moving average of stocks making new lows did tick up for both Nasdaq and the NYSE. That’s normal, but you do not want to see them rising with any gusto as we head into that intermediate term overbought condition.
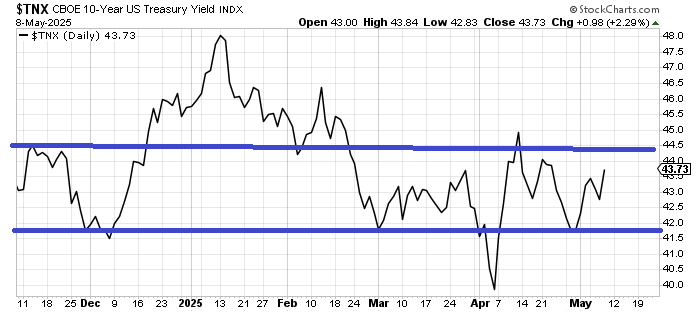
Then there are the bonds. Stocks are having quite a ride in the month of May, but bonds are going the other way as rates have gone from 4.20% to near 4.40% in just over a week. If this doesn’t stop at 4.50% as we get intermediate-term overbought, I’d consider that a negative.
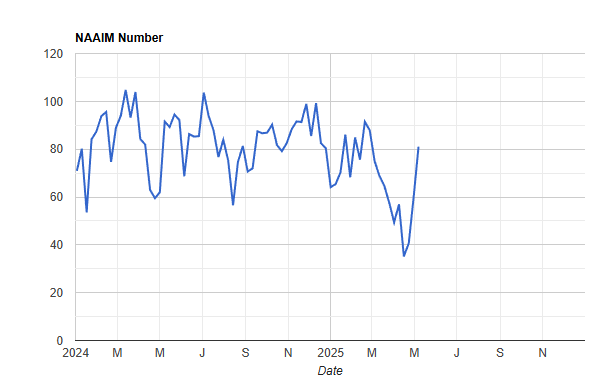
On the sentiment front, the AAII Bulls pushed up nine while the bears fell eight. Basically, after four weeks of rallying, they finally jumped the fence. But as of now, there are still more bears (51%) than bulls (29%). The NAAIM folks, though, have gone back in with both feet. Recall they finally gave up near the low, taking their exposure down to 35 and are now at 81. Maybe they haven’t gone on margin yet (over 100) but we can’t say they aren’t bullish. They are.
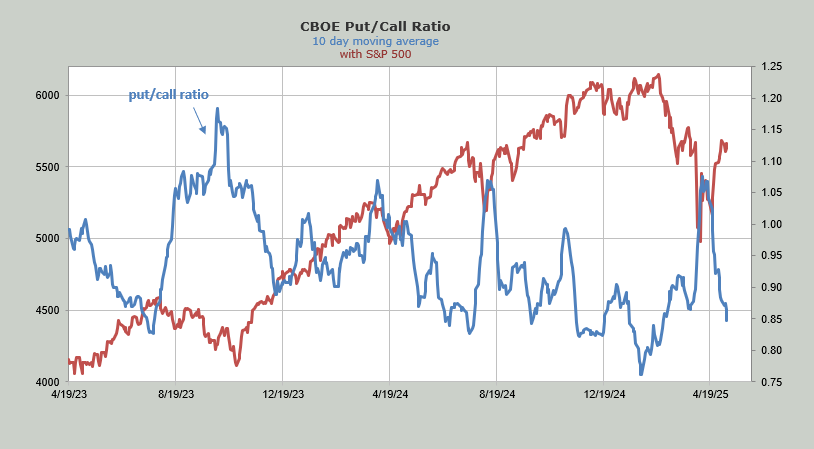
Finally, the ten-day moving average of the put/call ratio is now at 0.85. My estimation is that next week, probably regardless of what the market does, we see this moving average turn up. So here, too, we have to say the sentiment has shifted.
I still think there will be more rallying attempts because we are not yet intermediate-term overbought, but there is much to watch as we approach that time frame. Do the highs and lows improve? Does breadth falter? And what do the bonds do?