Beware These Overcrowded Agriculture Trades
Taking a closer look at wheat, live cattle and coffee.
You've reached your free article limit
You've read 0 of 1 free Pro articles.
Being a contrarian thinker is both an asset and a curse. Socially, it can be a hindrance to fitting in with the masses. This mindset prevents us from enjoying the ride when things are going well and lures us into strong opinions too early. But on the bright side, being skeptical of consensus thinking in markets might keep us from getting slaughtered with the herd.
We monitor two key factors in our quest to identify overcrowded trades: the Commitments of Traders (COT) report issued by the U.S. Commodity Futures Trading Commission (CFTC) each Friday and the Consensus Bullish Sentiment Index. The report can become relatively complicated, but we focus on the Large Speculator category of non-commercial traders. In English, this means large traders (with substantial quantities and deep pockets) who are speculating rather than hedging their price risk. In short, they aren’t farmers or ranchers; they are individuals and maybe even funds who are trying to beat the market. As humans — and even computers often do — they get over their skis by piling onto a trend. Yet, as we all know, the trend is your friend until it ends.
Similarly, the Consensus Bullish Sentiment Index is a weekly quantifiable account of bullish sentiment among industry insiders. The index is reported per market, with a value ranging from 0% to 100%, where 0% indicates that there are no bulls in the sample polled, and 100% means that everyone in the sample is bullish. Of course, readings of 0% and 100% are unlikely, but any reading below 25% or above 75% suggests extreme sentiment. A reading of 25% or lower indicates overcrowded bearish sentiment, and a reading of 75% or higher suggests overheated optimism.
Below are some markets that we have identified as being overdone. In other words, those positioned in the direction of the trend might be nearing the point of overstaying their welcome.
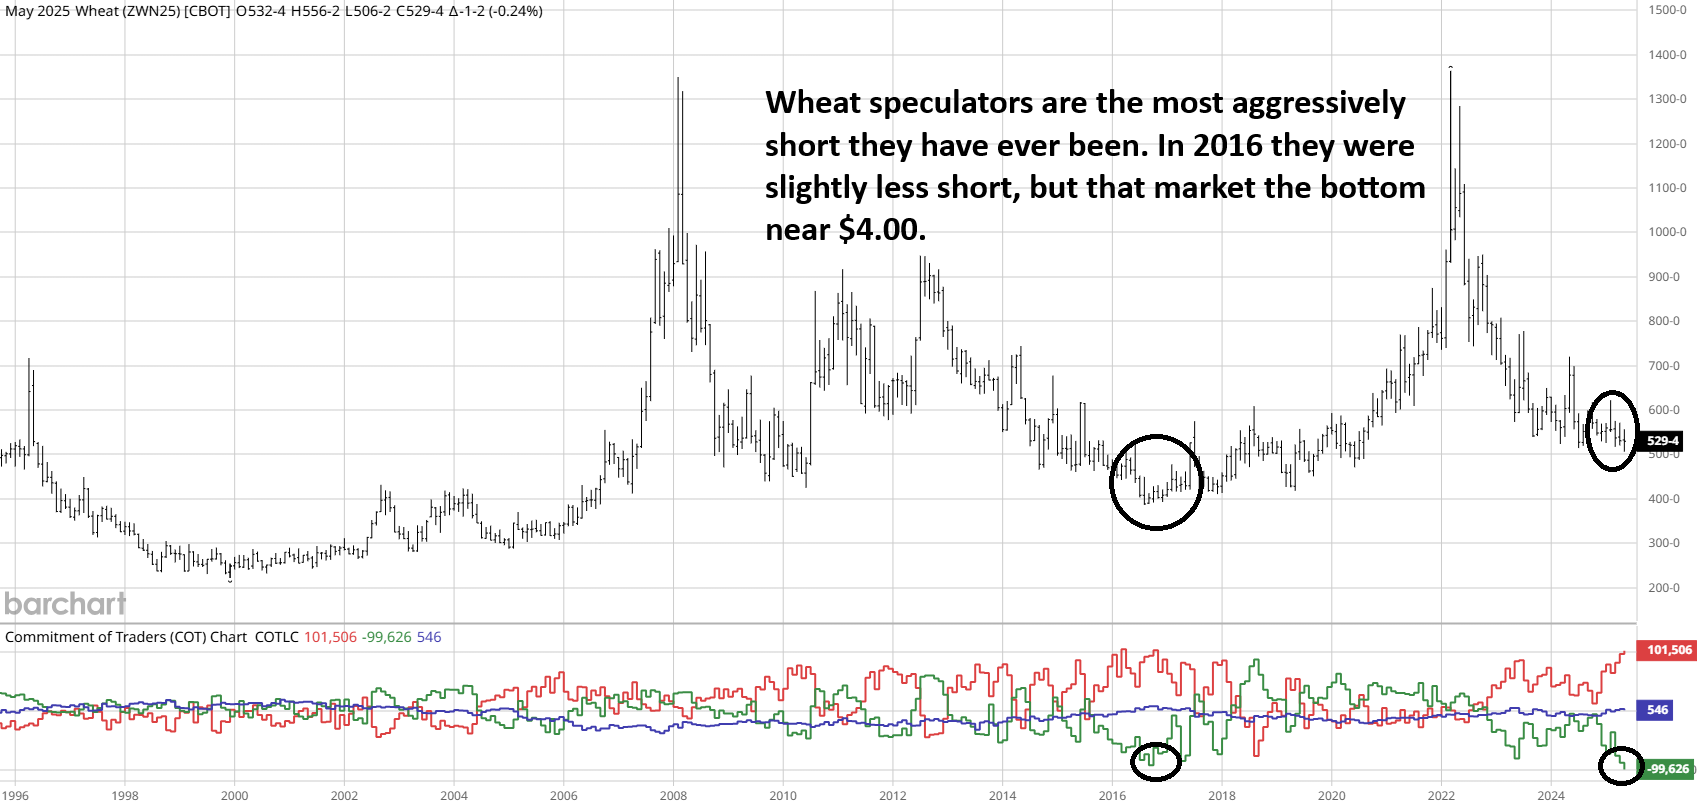
Wheat (CBOT)
Consensus Bullish Sentiment Index: 24% Bullish
Large speculators are holding the most prominent bearish position ever recorded in wheat futures. However, there was an occurrence at the tail end of the 2016 commodity bear market in which this group of traders was almost as short. The aftermath was an unwinding of that position that pushed prices 50% higher within a year and eventually paved the way for a tripling of the 2016 price.
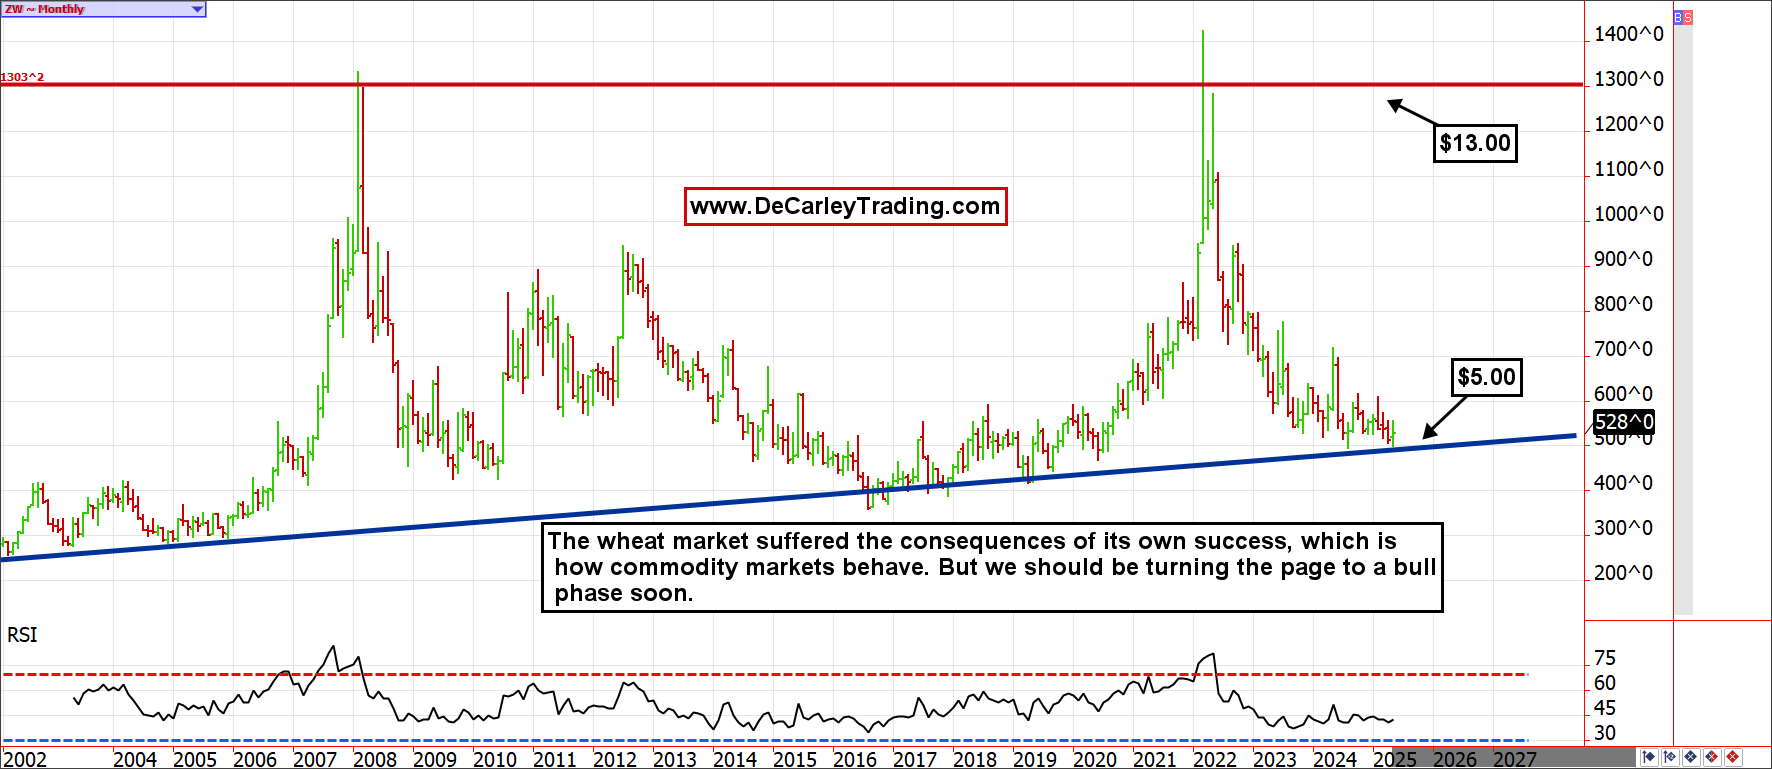
The 2016 low was nearly $4.00, roughly a dollar below current pricing. However, the 25-year trendline suggests $5.00 wheat is the new $4.00. Coincidentally, the previous trendline test occurred near $3.00, and each of these tests of support has occurred roughly 10 years apart. Markets don’t always repeat, but they often rhyme.
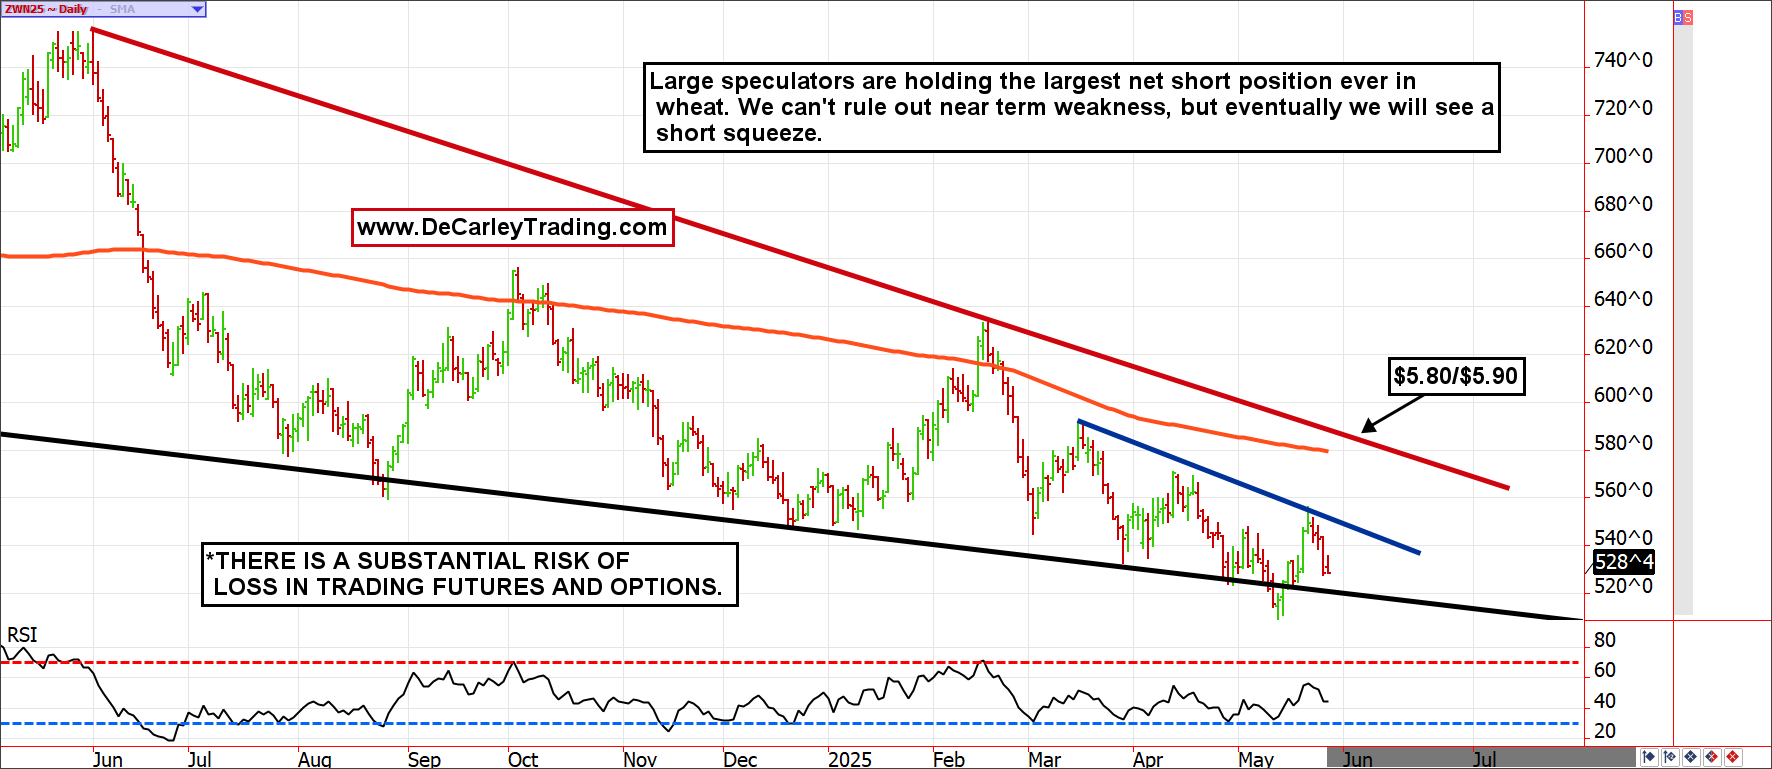
Narrowing in on the daily chart, a reverse head-and-shoulders pattern appears to be forming. Even so, it could mean wheat retests the daily chart downtrend line or pokes a little below it, but we don’t think this is a place to be short wheat, even though the majority are positioned as such. In fact, this might be the best time in a decade to be a wheat bull.
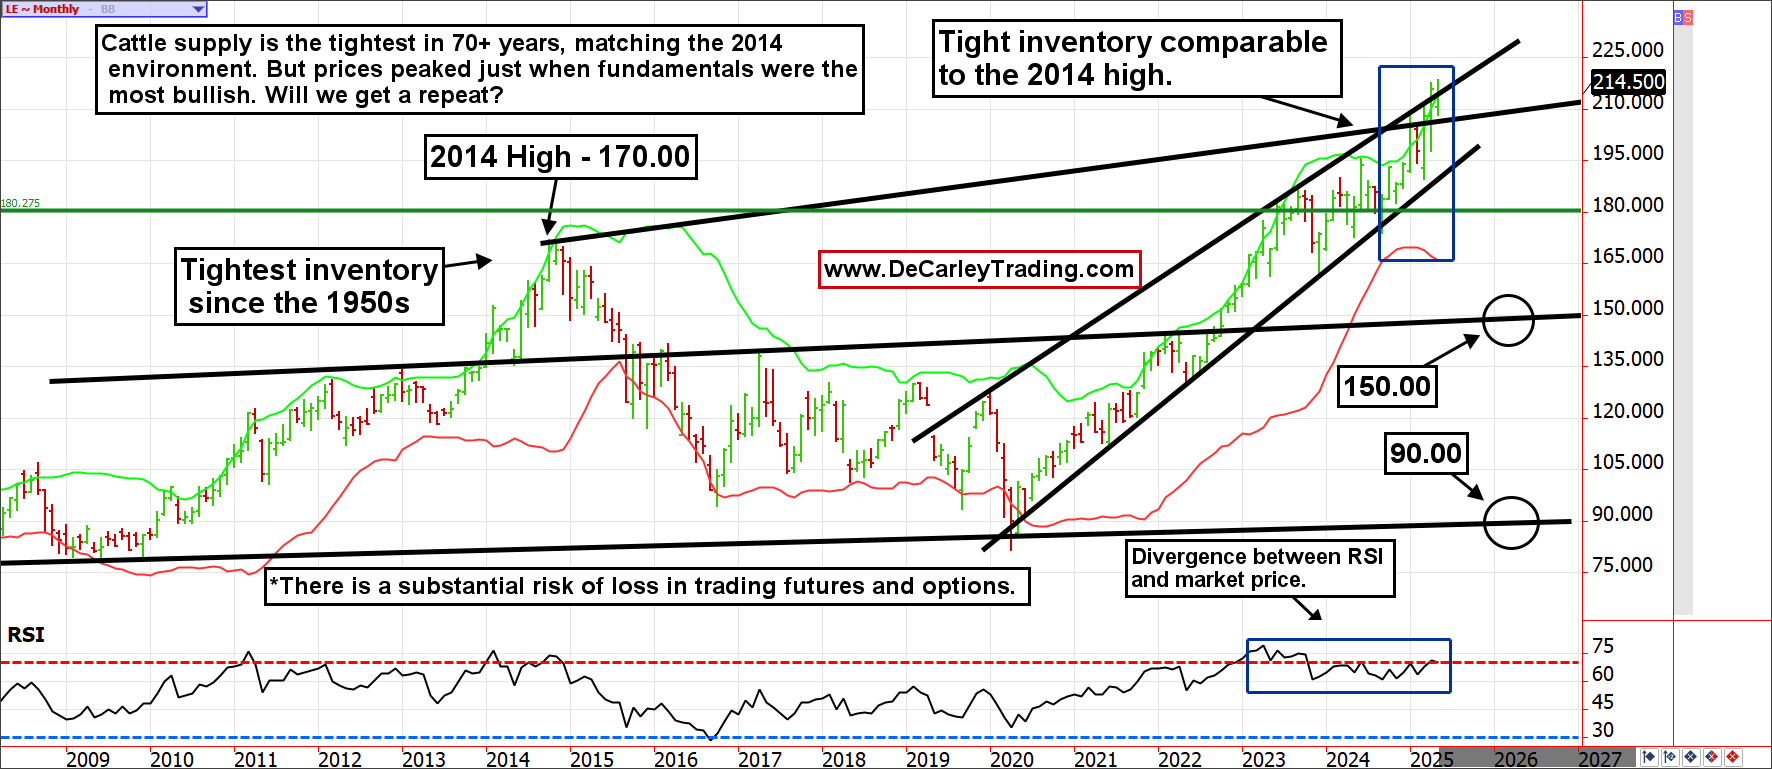
Live Cattle
Consensus Bullish Sentiment Index: 78% Bullish
In commodities, bear markets are the norm and bull markets are the exception. With this in mind, it has been stunning to see the resilience of the cattle market over the last five years. It has been the one commodity that has avoided the inevitable bust following the boom.
However, with 78% of industry insiders bullish and speculators holding one of the largest net long positions in history, this market is an accident waiting to happen. Previously, whenever large speculators were net long over 100,000 contracts in live cattle, the market broke hard; three of the four instances saw a $30 break in cattle, but the fourth occurred in 2014 and led to a break of $80!
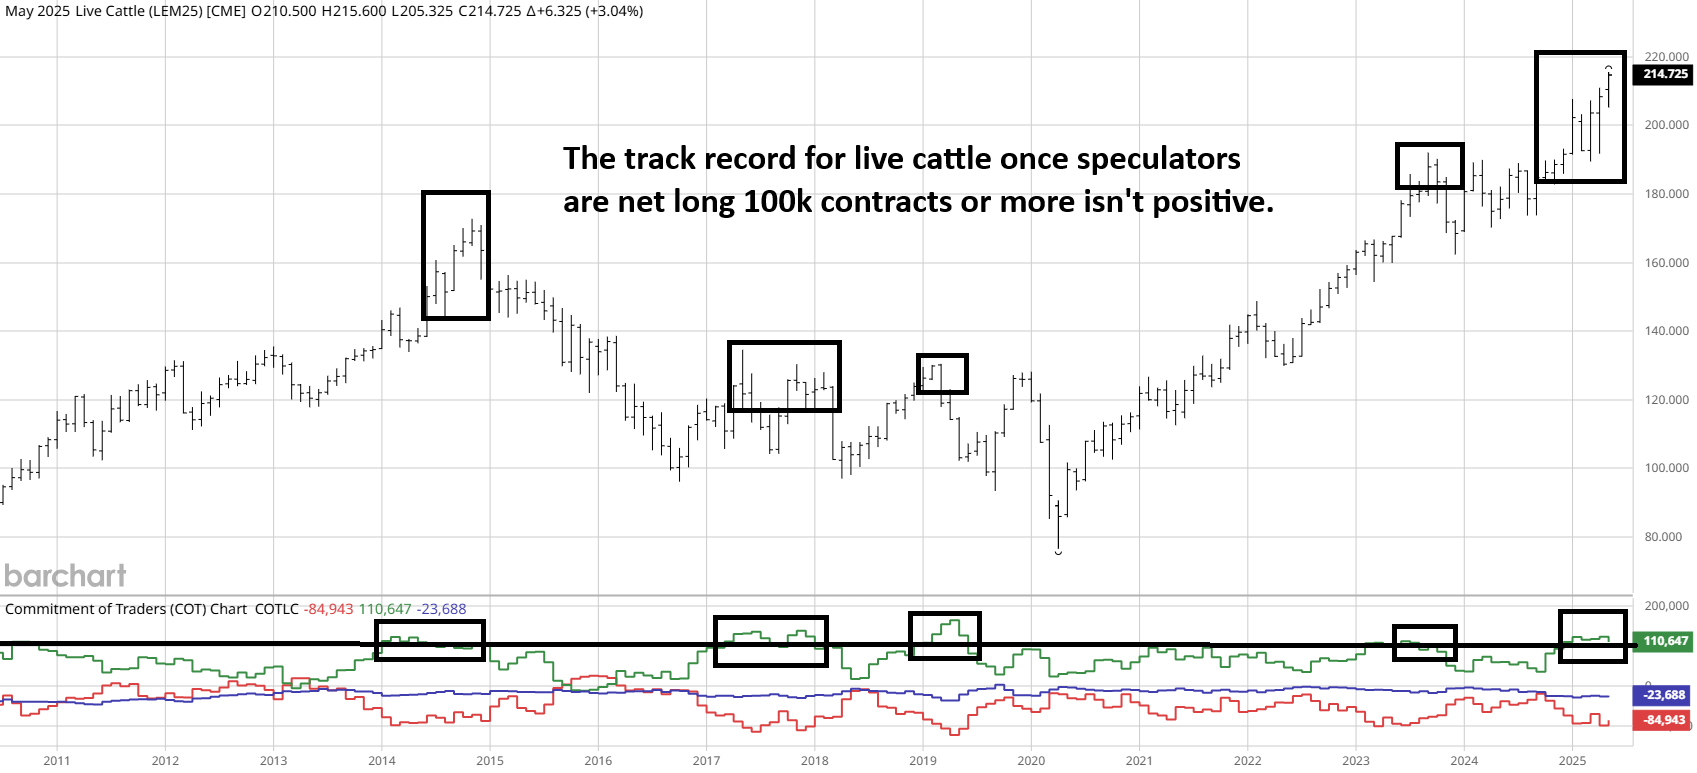
With everyone all bulled up on the board, in the pen, and in their minds, it is hard to imagine prices revisiting $150.00, let alone $100.00, but history says that’s not only possible but probable. The monthly chart reveals a divergence between price and the Relative Strength Index (RSI) technical oscillator. This pattern almost always ends in an abrupt trend reversal, but it can take several months to unfold, making timing a significant challenge.
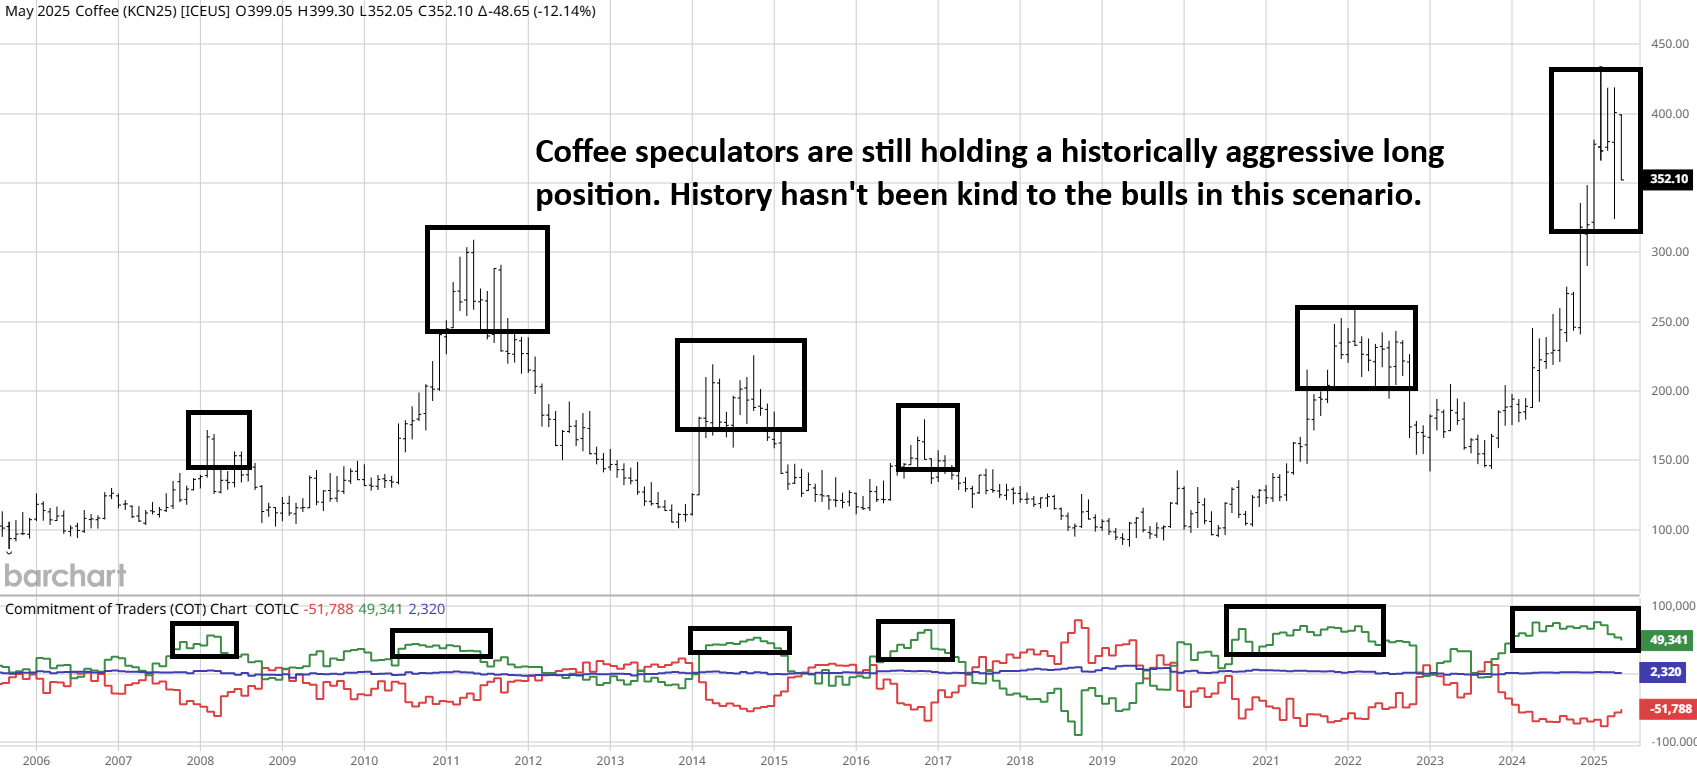
Coffee
Consensus Bullish Sentiment Index: 75% Bullish
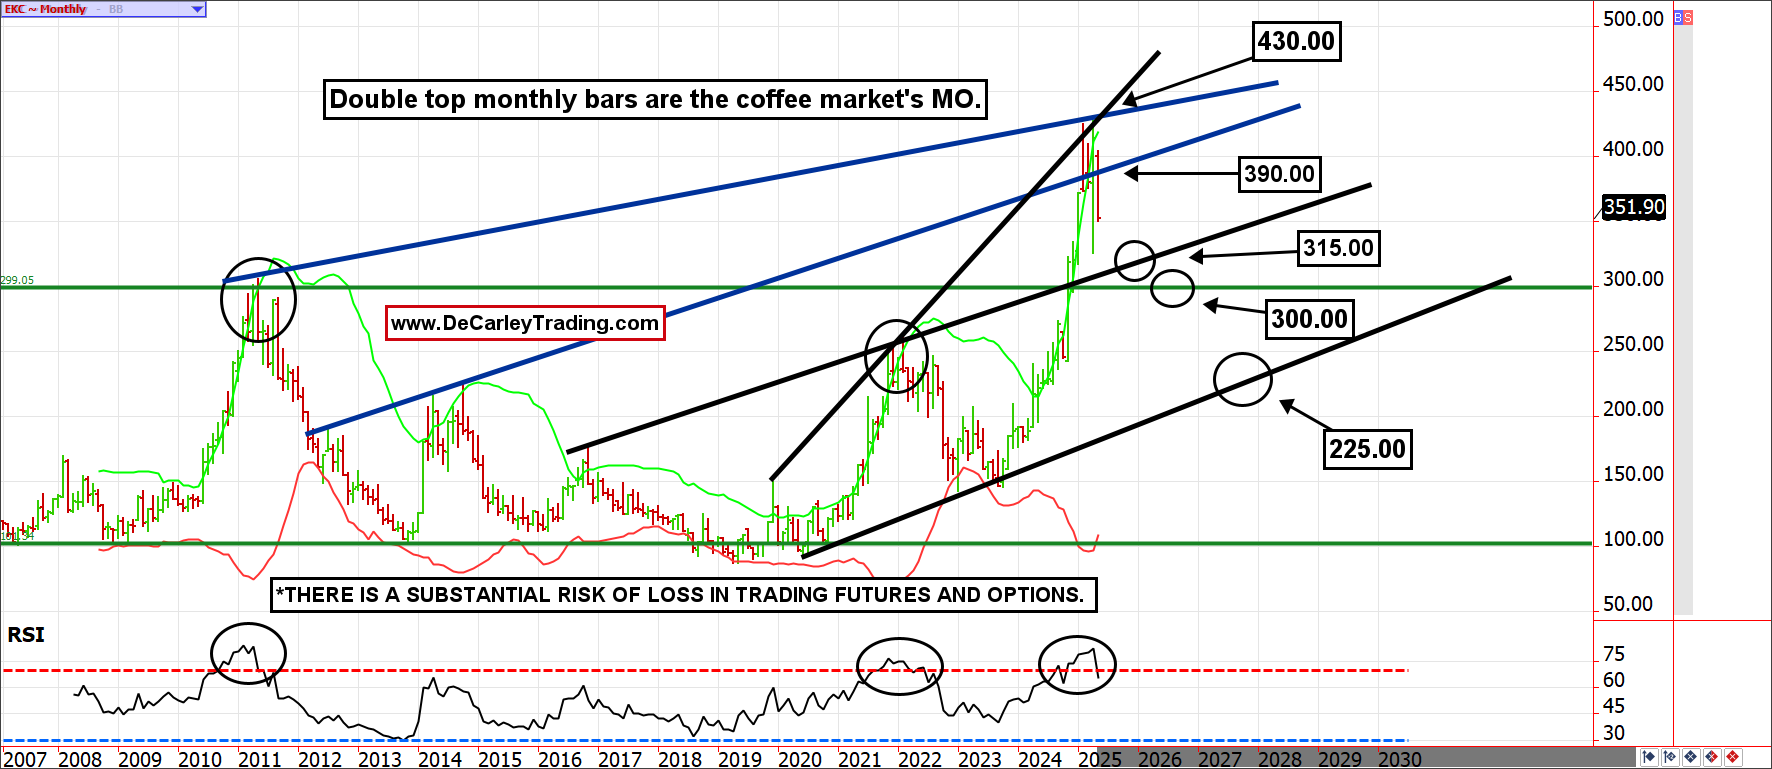
It might come as a surprise to see this commodity on the list, given that it has retreated 70 cents from its April high. However, despite the pullback, analysts remain wildly bullish, and speculators continue to hold oversized long positions. We can’t help but notice the similarities between the 2020 to 2025 coffee market and that of 2007 to 2012. If this is a repeat of that cycle, the coffee market could, and should, eventually give back the entire second rally. That would leave prices somewhere in the $1.50 range.
However, if we are talking about the next six months, rather than the next two or three years, the bears would likely target the monthly trendline offering support near $225 or lower if prices fall quickly, but higher if they take the scenic route.
It’s OK to be a contrarian, but be sure to mind your risk!
