Bearish Warning Signs Develop for the S&P 500 and Nasdaq
On a day equity markets are closed to honor President Carter, and one barometer has good news, the major indexes are starting to send technical warnings that could be very impactful.
You've reached your free article limit
You've read 0 of 1 free Pro articles.
As most readers likely know, there will be no opening or closing bells ringing Thursday at either the New York Stock Exchange or the Nasdaq MarketSite. It is not a federal holiday, but as has been tradition on Wall Street since long before I showed up, U.S. stocks do not trade on national days of mourning as a show of respect. President Jimmy Carter's state funeral will take place later this day at Washington National Cathedral.
Options trading will also be shut down for the day at the CBOE and the BOX Exchange. However, bonds will trade until 2:00 p.m. ET, so financial markets are not completely closed Thursday. As a result of the bond market being open for trade, the New York Fed Open Market Trading Desk will be open as well.
Away from financial markets, this is not a bank holiday, the Federal Reserve Bank payments system will operate normally, but you will not get your snail mail, and federal courts will be closed. This is the first day of mourning for the passing of a former U.S. president since President George H. W. Bush was mourned on December 5, 2018.
A Good News Barometer
We know that Santa Claus posted a loss for the season, which was Santa's second consecutive year in the red. No sweat. That's just a seasonal trade, and 2024 was a very nice year for U.S. equities in a broad sense. Wednesday may have been a sloppy day, and it came after a significant "down" day on Tuesday for U.S. equities, but more importantly, Wednesday was the fifth trading day of 2025.
The mid-major to major indexes closed up small on Wednesday, allowing all of them to post winning first-five-day periods for the year. According to this barometer, the "First Five Days" indicator, market direction for the first five days of January can foretell the equity market's direction for the full year. Is it accurate? It's difficult to tell the difference between correlation and causation.
I think it's merely coincidence, but like the Santa Claus rally and the "January Barometer" (which projects the whole first month over the full year), the legend seems to work about three quarters of the time, at least since I've been in the markets professionally, which is almost a 40-year period.
Five days in, the S&P 500 is up 0.62% year to date, while the Nasdaq Composite stands up 0.87% and the Russell 2000 is up 0.39%. Call it a "W" for the indicator. Among mid-majors, The Dow Industrials and Dow Transports are up 0.21% and 1.33%, respectively, while the Philadelphia Semiconductors are up a whopping 3.66%. The KBW Banks are up 1.55% a week ahead of earnings.
Sit back and relax? Not good advice in my book, but legend has it that 2025 might not be so bad for the net-long crowd.
Warning?
While the above might seem like positive news, the major indexes are starting to send technical warnings that could impact if not the next full year, at least the next notable market move.
I spend a lot of time showing readers shorter, less in-depth charts of the S&P 500 when I am trying to determine if we have witnessed a "Day One" change in trend or a follow-up "Confirmation Day." Within the past week, we have seen near "Day Ones" in both directions that I have had to explain in my columns why they were not.
Now, let's step back and see what the "technicals" are telling us.
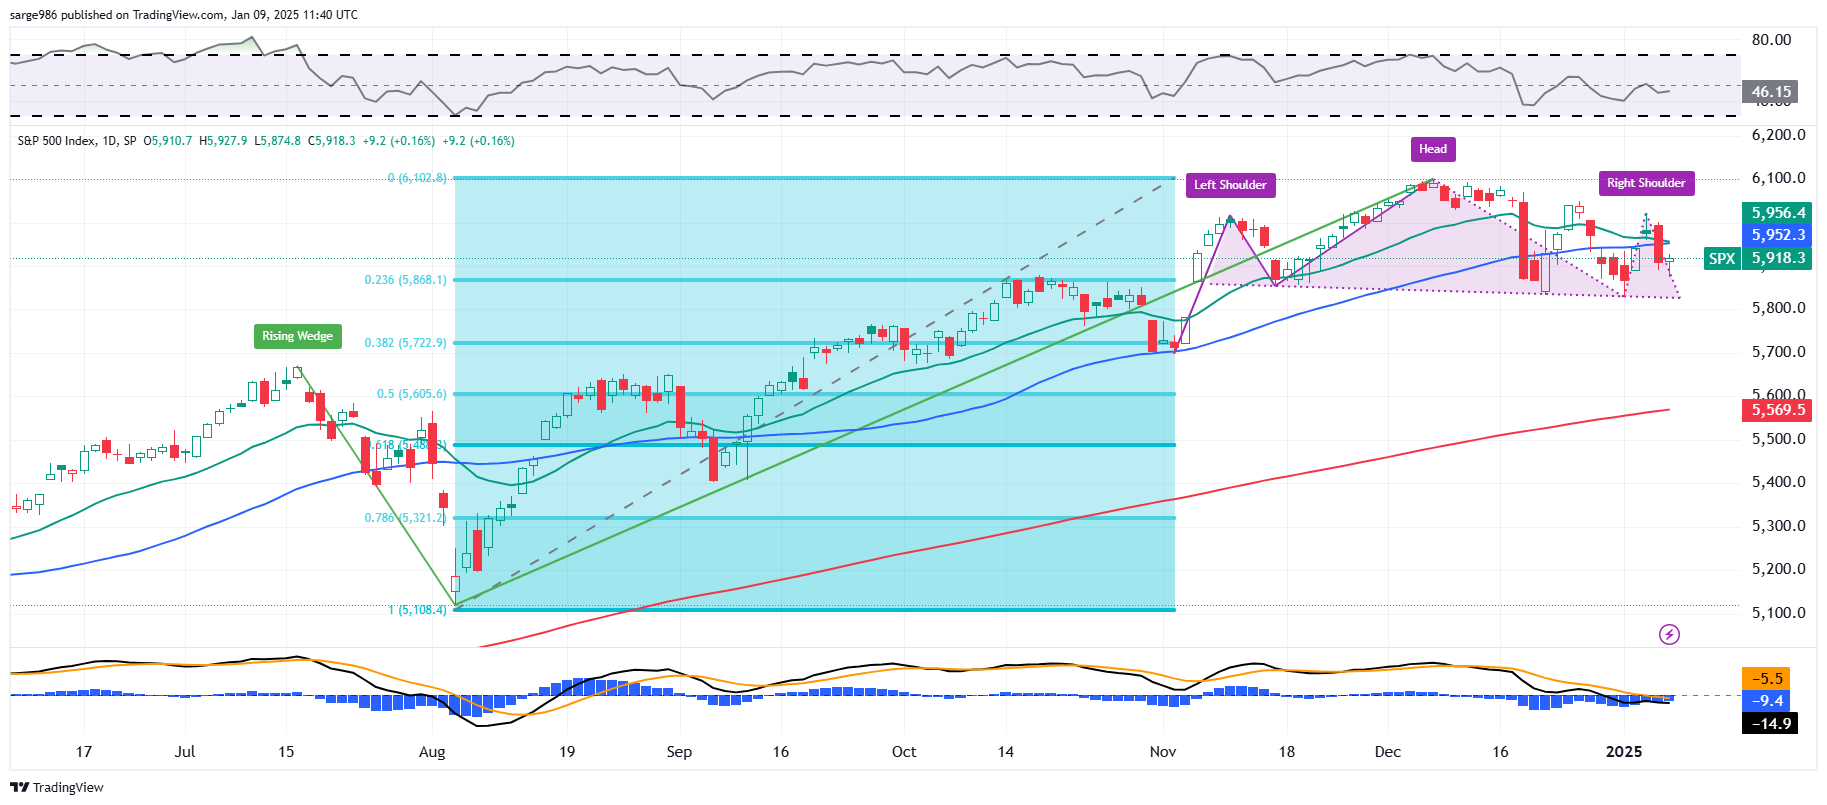
Readers will note in the chart above that the S&P 500 has developed a head-and-shoulders pattern (which is a pattern of bearish reversal) stretching from very late October into 2025. The pattern displays a neckline at 5827, which would be the downside pivot.
Interestingly, readers may notice that this neckline runs almost even with what would be a 23.6% Fibonacci retracement of the rally from the August low through the December high, making this level all that much more significant as it provided support multiple times as the head-and-shoulders pattern developed.
Relative Strength is still neutral, but the daily moving average convergence/ divergence (MACD) has now postured itself more bearishly with the histogram of the 9-day exponential moving average (EMA) running below zero and the 12-day EMA having crossed below the 26-day EMA. Take note as well, that the S&P index is also undergoing a swing traders' or mini-death cross (The 21-day EMA crosses below the 50-day simple moving average (SMA)) in real time.
Should that neckline crack, readers will see that the halfway back point or 50% retracement of the August into December run stands at 5605. As a reminder, while 50% retracements are common, they are not true Fibonacci levels but are their own thing. Should the S&P 500 drop that far, the 200-day SMA could be in that area by that time, making that level all the more significant.
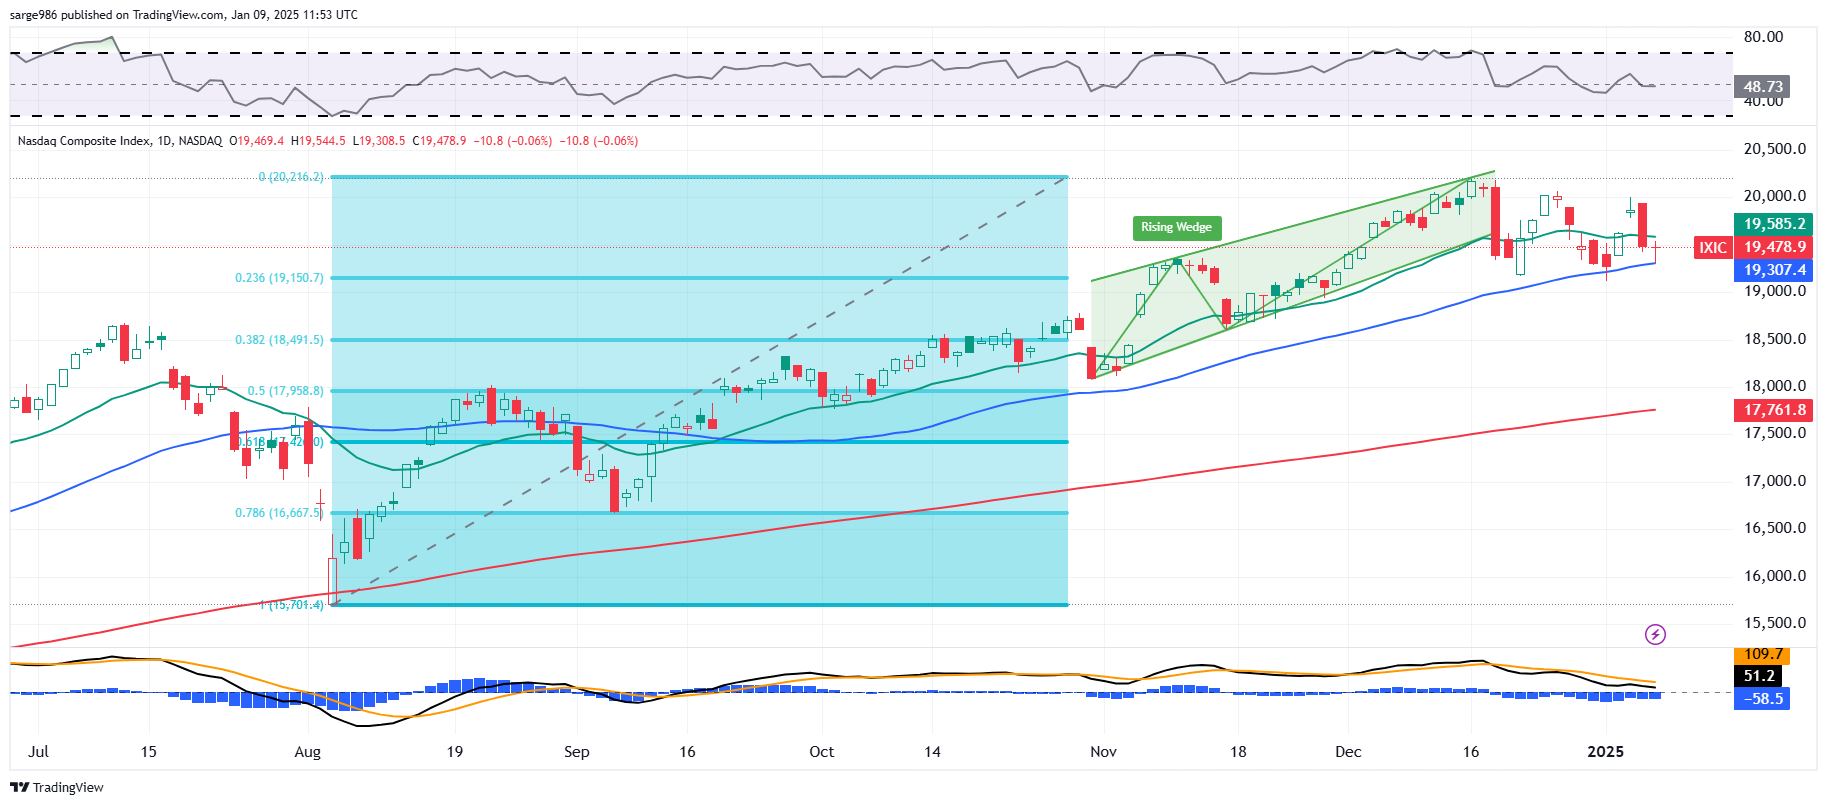
The Nasdaq Composite presents us not with a head-and-shoulders pattern, but a rising wedge pattern, which is still a pattern of bearish reversal. Currently this index has been able to hang onto support at its 50-day SMA, which could be crucial on Friday after the December jobs data is released.
Similar to what we see above with the S&P 500, Relative Strength is neutral, but the daily MACD has turned bearish. While the histogram of the 9-day EMA is below zero and the 12-day EMA has crossed below the 26-day EMA, both those 12- and 26-day lines remain above zero, which is potentially less bearish.
Whereas the S&P 500 sports the neckline of a head-and-shoulders pattern as pivot, the Nasdaq Composite sports support at the 50-day SMA. Should that line crack, the index could make a run for the 200-day SMA, which would be quite the selloff. Here too, a 50% retracement of the August into December run and the 200-day SMA could be running together by the time they might be approached. This of course makes that sport more significant both as support and as a magnet.
My Thoughts
Do these negative scenarios have to play out? Of course not. There have been many negative (and even positive) setups over the years, especially in recent years, that have not played out to their worst-case possibilities before a new pattern that says something else shows up. That said, as a trader, as an investor and as your very best pal, I would be remiss not to point out that there are technical warning signs out there right now that the mainstream financial media just won't cover.
Have a nice Thursday, gang. I'll catch you all on Friday, which is December Jobs Day.
Economics (All Times Eastern)
07:30 - Challenger Job Cuts (Dec): Expecting 65K, Last 57.727K.
The Fed (All Times Eastern)
09:00 - Speaker: Philadelphia Fed Pres. Patrick Harker.
12:45 - Speaker: Richmond Fed Pres. Tom Barkin.
13:30 - Speaker: Kansas City Fed Pres. Jeffrey Schmid.
13:35 - Speaker: Reserve Board Gov. Michelle Bowman.
Today's Earnings Highlights (Consensus EPS Expectations)
No significant quarterly earnings scheduled.
At the time of publication, Guilfoyle had no positions in any securities mentioned.
