As We Wait to Hit Discouragement, Let's Use History as a Guide
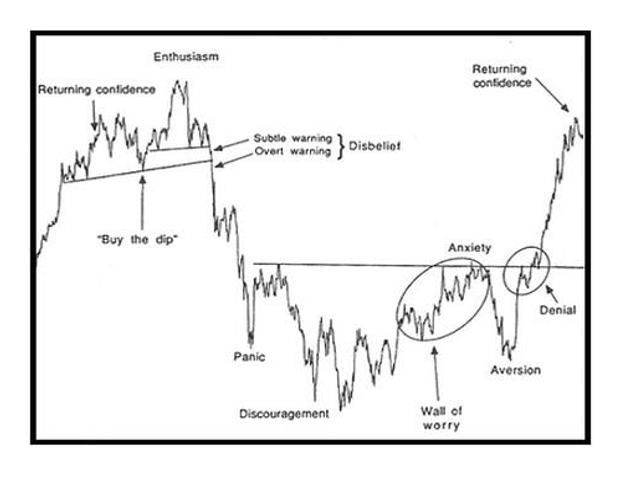
The Sentiment Cycle can be a useful road map. What does it say about where we are now?
You've reached your free article limit
You've read 0 of 1 free Pro articles.
Note: Since Friday is a holiday, this is my last column for the week. My next column will be Monday, April 21st. Happy Easter to all who celebrate!
I have been using the Sentiment Cycle as a general guide for where I think we are in the process of the market. Two weeks ago, we were on the verge of Panic, and last week we got said Panic.
Since we got the panic and the subsequent rebound, I have thought we were in that little period just after the rebound from Panic. Call it a sideways chop. As we looked at the charts from 1990 the other day and also from the post-9/11 period, we were able to see that the actual shape of the chart was different, mostly due to the time factor, but in both cases, the rebound off of Panic did not lead to a V bottom.
In 1990, the chop lasted a few weeks before heading down to discouragement. In 2001, it lasted six months before heading back down, and we did not make a lower low (than Panic) until July of 2002, so that was nearly ten full months to get to discouragement.
I was asked if we can just head down to discouragement now, so I want to address this. We can; there is no rule that says we can’t or won’t. But even if we look at the mild 2022 bear market, it still took from the high in January 2022 (or November 2021 in some cases) until the fall of 2022 to make a proper low and get to discouragement. So why should this much more violent decline be over in a matter of a few weeks or even a few months?
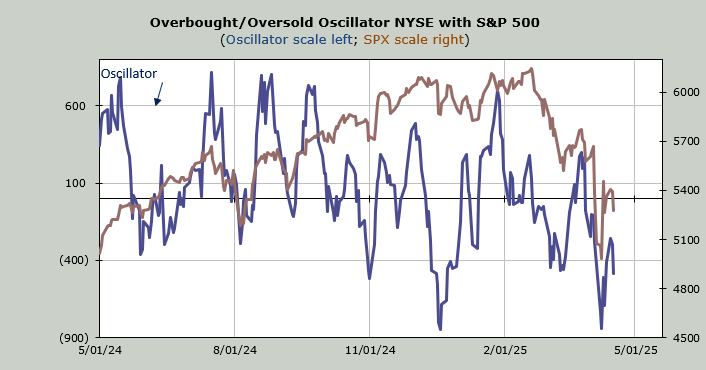
Yet I did say earlier this week that if we pulled back, I would look for another rally. It wasn’t just because of the pattern on that chart above; it is because of my Overbought/Ovesold Oscillator.
I use the ten-day moving average of the net of the advance/decline line to calculate this. So, I take a look back ten days to see the numbers we are dropping. If we are dropping a string of negative numbers, I think we are oversold, and a string of positive numbers says we are overbought.
For the next four trading days, this indicator will drop four rather hefty negative numbers. Now, we can’t say we’re oversold (because we are not), but we can think the market should rally one more time. Here are the numbers we are dropping in the coming days.
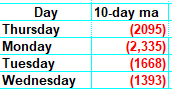
And the chart of the Oscillator as well. I have also noted (due to the numbers we are dropping) that I expect the Oscillator will get to or even cross that zero line. I have also said if it can’t do that (by the time we finish dropping these numbers) then the market is much weaker than even I think it is.
There is always the risk of looking for one more rally, and you’re wrong, but that’s where I stand. I still think we are eventually going to come down to Discouragement on that chart. There is far too much resistance overhead for me to think we’re heading straight back up, but a rally is what I think for now.
Finally, just to update you on Gold sentiment. The Daily Sentiment Index (DSI) is back to 87. It hasn’t gotten to 90 yet. Perhaps it will do so on Thursday, but for now, it’s still in the upper 80s.
