As We Debate Whether the Low Is in, Let's Look at the Sentiment Cycle Chart
The Sentiment Cycle is an excellent framework to help us understand how other traders may react over the coming weeks.
You've reached your free article limit
You've read 0 of 1 free Pro articles.
My inbox is bombarded with ‘Is that it? Is the low in?’.
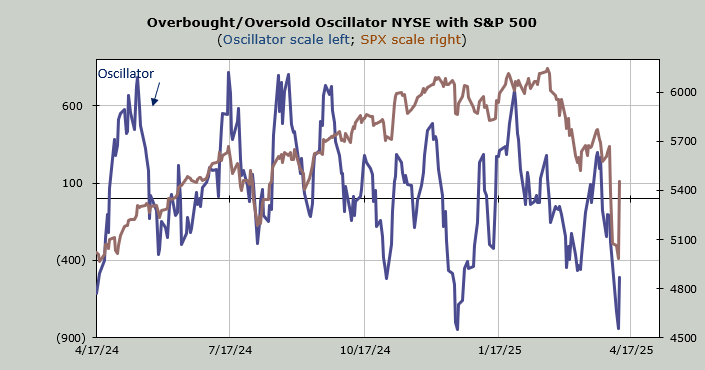
So let’s go back to the chart of the Sentiment Cycle which I know I have been posting here on a regular basis so I promise I will let up for a while after this! On Monday I thought we came into the week heading toward Panic. And due to the oversold condition, I thought we should rally off of it.
I think that’s what Wednesday’s rally was: that rally off of Panic. Now I would say we are somewhere in that green box. Remember the pattern need not be exact—even if it does look so similar to that of the current QQQ or Nasdaq chart.
What tends to transpire off that initial Panic rally is—more rallying attempts even if the very next day has no follow-through. But notice that it tends to get choppy. It doesn’t tend to head right back down again. But it also doesn’t tend to fly back to the highs either.
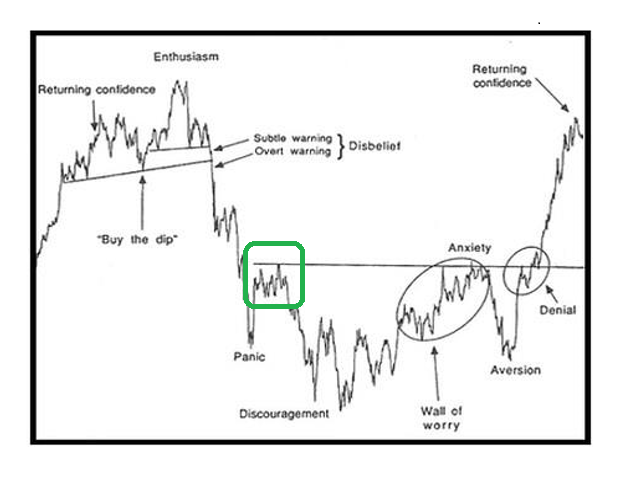
What you will also notice is that at some point, typically weeks or months later, we come back down again. But for now, I think we’re heading into the green box.
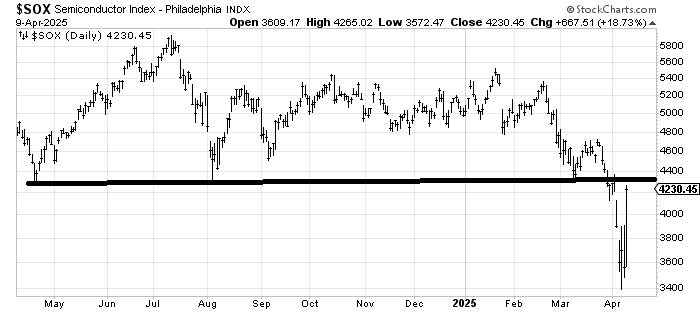
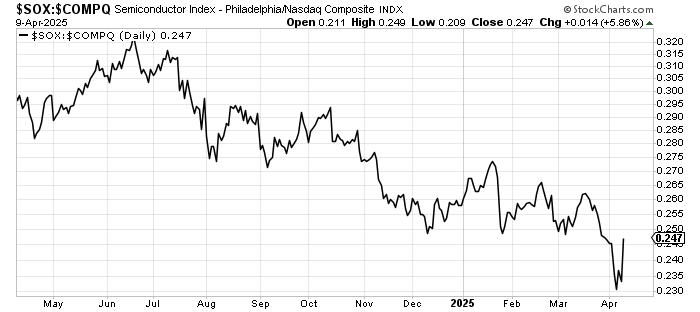
One reason I think this is because there has been so much damage to the charts and that takes time to repair. Just think of the SOX which we have been using as a trading tool lately. It is going to run smack into first resistance at 4400, although my guess is it gets through it on the first try but then stalls out not long after.
Yesterday I noted that the SOX relative to the Nasdaq was holding steady and on Wednesday it spurted upward (the ratio). So one thing we can do now is watch for signs that the ratio is faltering. Notice it does not tend to turn lower on a dime but makes several valiant attempts at making a higher high first.
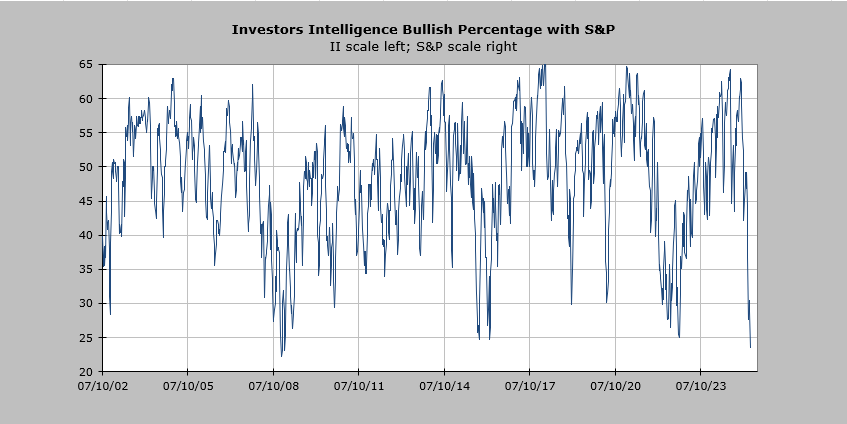
Then there is the Investors Intelligence Bulls which fell to 23% this week. This is the lowest they have been since they were 22% in October of 2008. The majority of stocks made their lows in October of 2008 but then we had to go through the bottoming process over the next five months. That means Discouragement (from the Sentiment Chart) is still out there.
My best guess is that we’ll rally a bit more, get choppy, and then rally again. And then we’ll be back to an overbought condition. The Oscillator ought to make its way back to the zero line, and probably a bit higher than that. If it can’t get over the zero line then the market is weaker than I think it is.
I continue to think this is a trading market.