As the Stock Market Gets Overbought, Here's What to Expect
Let's dig into the momentum indicators.
You've reached your free article limit
You've read 0 of 1 free Pro articles.
When the market clawed its way back to nearly flat in the middle of the day, I saw so many folks start in with all these statistics about prior times the S&P was up ten days in a row. But naturally, the market had other ideas and sold off into the close.
I was reminded that when I first started charting by hand, and the top of the chart was, say, $80, and the stock would trade to around $78, so I would anticipate the stock going over $80 and cut and paste the chart in advance. It never seemed to go over. My mentor in this business used to say that I jinxed it by anticipating. I scoffed.
But of course, he was correct. To this day, if I anticipate a stock going off the top and I cut and paste in advance, it is like I am the Kiss of Death. If you are curious, the same thing happens if a stock is in danger of falling off the bottom: if I cut and paste in advance, it is sure to rally.
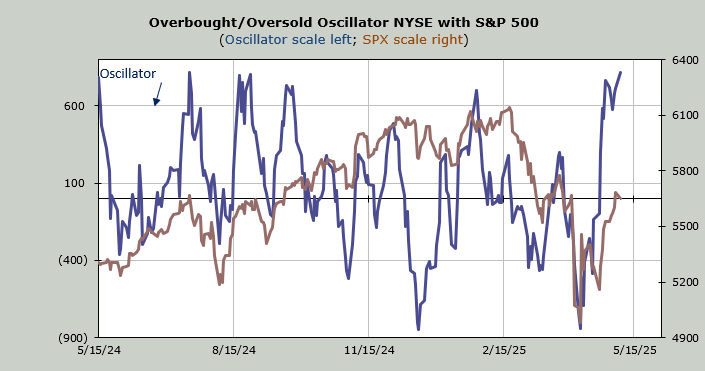
But let’s talk about the short-term overbought condition. Last week, we looked at the Nasdaq Momentum Indicator, which was set to get overbought on Friday. My own Oscillator has been overbought for nearly a week now. You can see it is trying hard to go off the top of the page (I do not cut and paste these computerized charts, so there is no chance of me mushing it!).
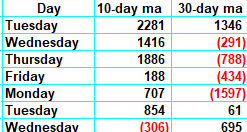
However, with the Oscillator, we are able to look at the numbers we are dropping off the ten-day moving average of net breadth. On the table below, you will see the first column shows the numbers we are dropping for the ten-day moving average, and the next column shows the numbers we are dropping off the 30-day moving average.
The ten-day numbers are rather large for the next three days. That’s what makes this market overbought. We need not go down every day, but we are sure to lack the upside momentum for most of those days.
The 30-day moving average still has some red numbers to drop (next week as well), so I don’t consider that as overbought yet. I do anticipate it will reach an overbought condition when it stops dropping red numbers (the week prior to Memorial Day).
A natural progression would be for a pullback this week and another rally attempt into the intermediate-term overbought condition. If we arrive at the intermediate term overbought condition with other indicators overbought or faltering (like the Hi-Lo Indicator rolling over) and sentiment having shifted toward too much bullishness, then I would begin to look for a more serious pullback.
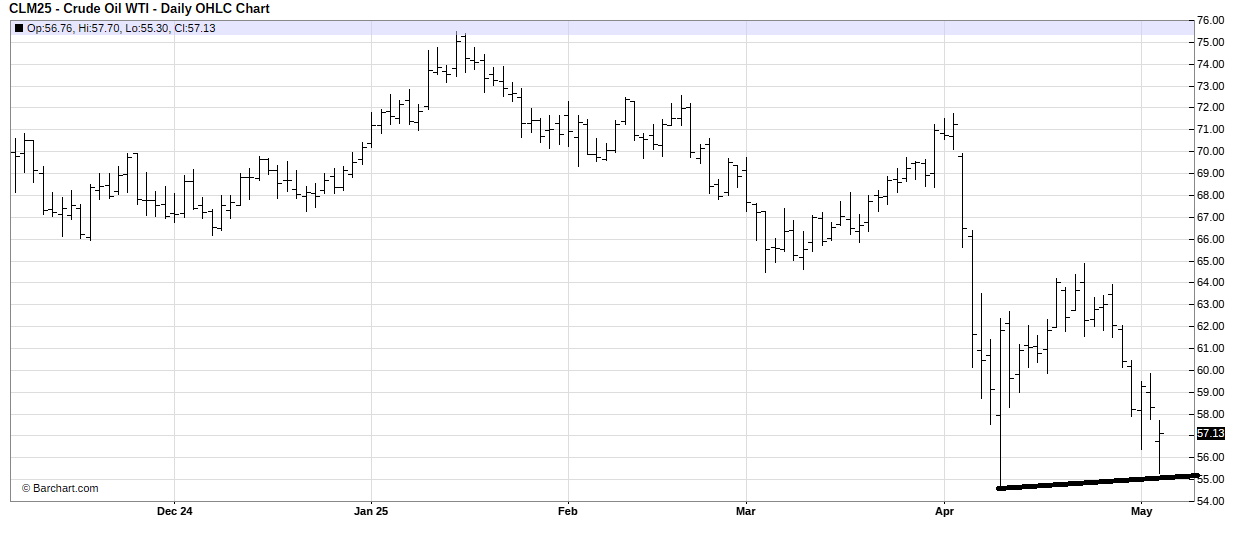
I will end by noting the folks on television finally seemed to notice oil. I guess it was hard not to with the OPEC announcement. The Daily Sentiment Indicator (DSI) got to 10 last week. It is 13 today. My view is that spike lows tend not to break, or only break by a minor amount, on the first trip down. I would expect if oil is down again on Tuesday, the DSI might fall to single digits. Either way, energy is close to a trading rally.