As Meme Stocks Rock and Earnings Land, Here's What You May Have Missed
Let's look under the hood at what's happening beyond the headlines as the market continues to take us to the edge and then back off and big-caps muscle their way back.
You've reached your free article limit
You've read 0 of 1 free Pro articles.
No one fussed over the Utes on Tuesday when they made a new high and no one fussed over them when they made a new high and closed lower on the day on Wednesday. Maybe that’s just part of the fact that there is so much going on with earnings and meme stocks that folks aren’t paying attention to the boring Utes.
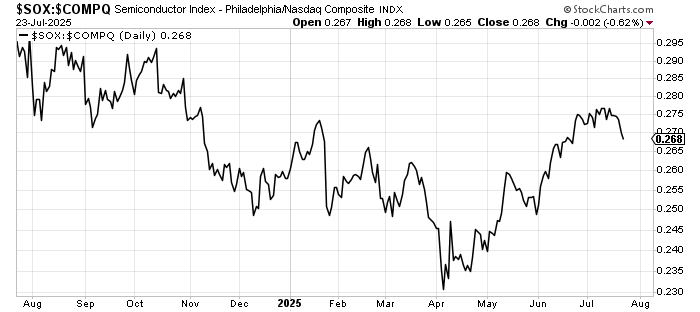
The most impressive action I saw on Wednesday came from the SOX. Despite the massive downside move in Texas Instruments TXN the SOX closed flat on the day. Relative to the Nasdaq it’s still heading down rather handily, but I still have to give credit when it can’t break down when one of its components gets whacked.
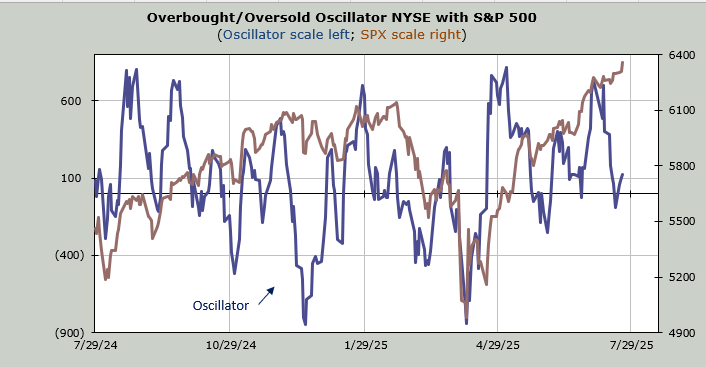
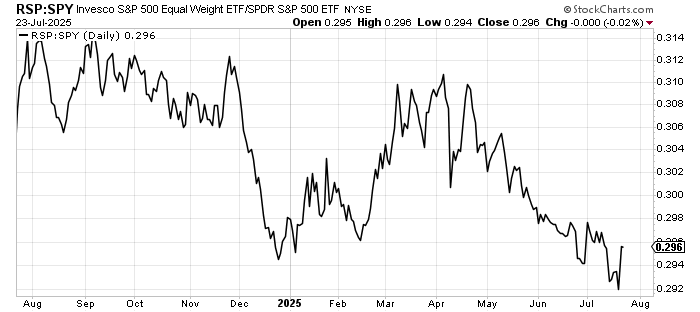
Once again breadth put in a good showing. But it wasn’t as good as it was on Tuesday when the S&P 500 was up a mere four points (vs. nearly 50 on Wednesday). I always find that curious because it means when we check in on the ratio of the RSP to the S&P we can see it did not change. This has been a constant issue with this ratio. As soon as "the others" get a leg up the S&P big-caps find a way to muscle their way back in.
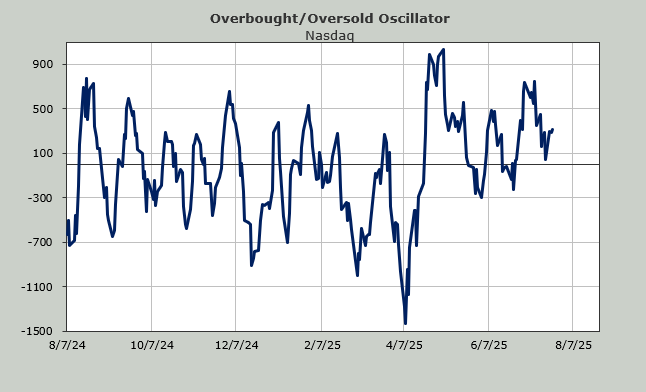
The McClellan Summation Index did, however, halt its decline. Now it needs another day of positive breadth to turn it back up. So basically the indicators didn’t really change. Not yet.
On the sentiment front, I see many saying folks are too bullish, especially with all the meme stocks rocking. They are bullish. But would it surprise you to know that the Daily Sentiment Indicator (DSI), which reached 87 for the S&P on July 3, is now at 77?
How can that be? Since the indicator is proprietary I can’t say but what I can say is that the 2+ weeks of going sideways eased that indicator from knocking on the door of extreme to more moderate. Will another few days of rallying lift it back to 87 or more? It’s hard to say.
What isn’t hard to determine is the VIX DSI. That is now at 15 so it is into yellow flag territory. Another day or two of rallying in the S&P would take this down to maybe 12-ish. I suspect we see a pop in the VIX before this gets near single digits. It's been that kind of market, one that takes us to the edge and then backs off. Why should this time be different?