Are You Panicked Yet?
As the market touches short-term oversold levels, we begin to look for signs of investor panic.
You've reached your free article limit
You've read 0 of 1 free Pro articles.
I will start with what changed in the market on Thursday, and no, I am not talking about the slide in Bitcoin because I still think it is garbage. The only thing I will say is that the DSI got to single digits (9). It last did so in November of 2022. It did so twice, once at the beginning of the month and once at the end.
What changed that we should care about is that they finally sold the 493, so for the first day this week, breadth was not green. To get a true change in sentiment, the hidey holes must be sold. Downside volume was only 71% on the NYSE, so I wouldn’t call it panic. Over on Nasdaq, it was 77% and believe it or not, that’s actually a relatively high number for Nasdaq. In the height of the Tariff Tantrum last year, the worst it got to 81% on Nasdaq, so 77% is 'up there’.
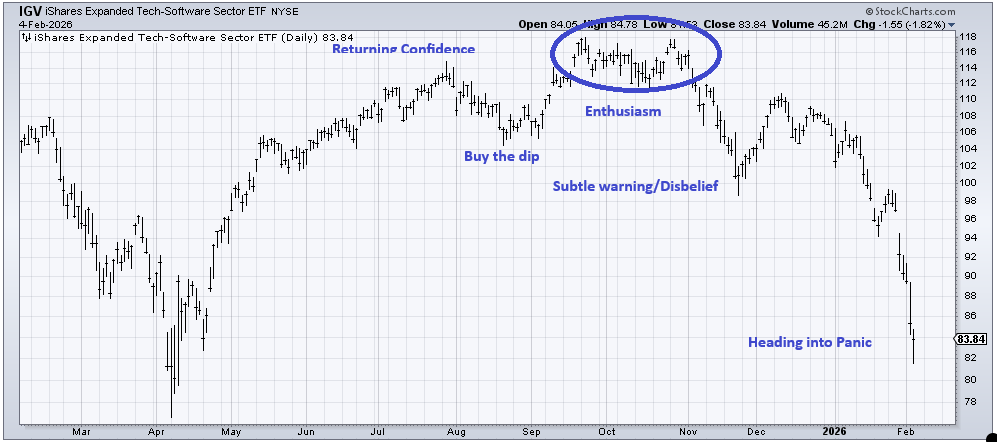
The other thing that changed is anecdotally, I did not see anyone quoting the RSI of IGV, the ETF to be long software stocks, as they were earlier in the week. I also did not see anyone, as I had all week, being a hero, saying they will buy the software stocks. It’s a change in tone.
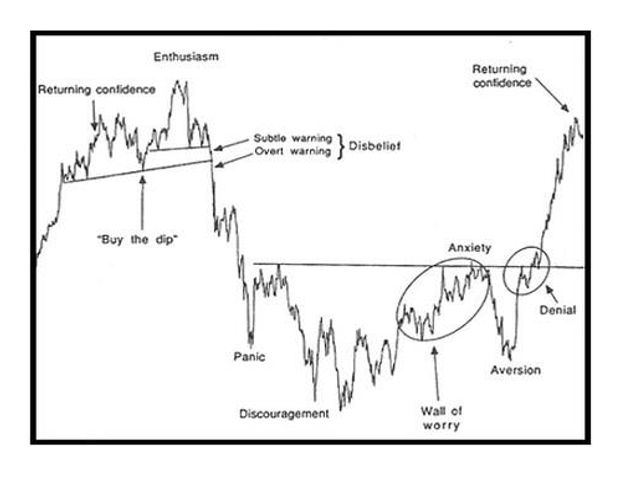
I did take the liberty of matching up the chart of IGV with the Sentiment Cycle created by my mentor, Justin Mamis. I think it fits rather well (Thursday’s action is not on the chart). I do think we are heading toward panic.
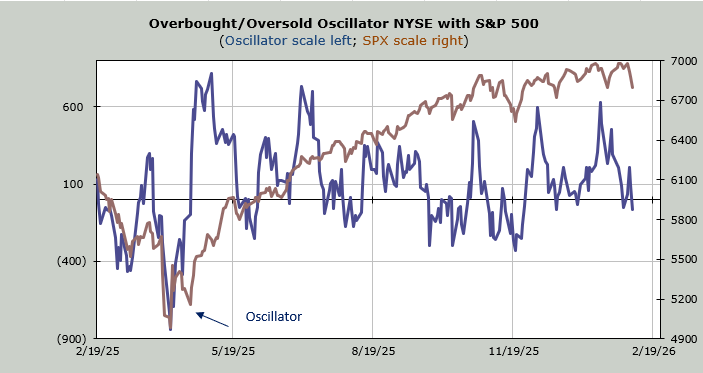
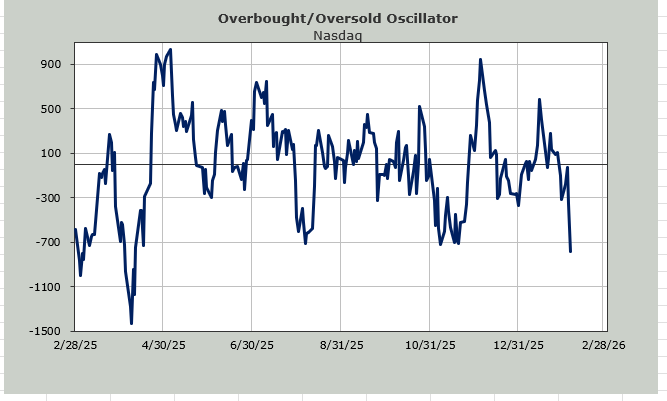
I do think we are heading toward an oversold condition, as I have noted all week. My Overbought/Oversold Oscillator is now finally at the bottom of the page. Eight of the next ten trading days, this ten-day moving average will drop negative numbers.
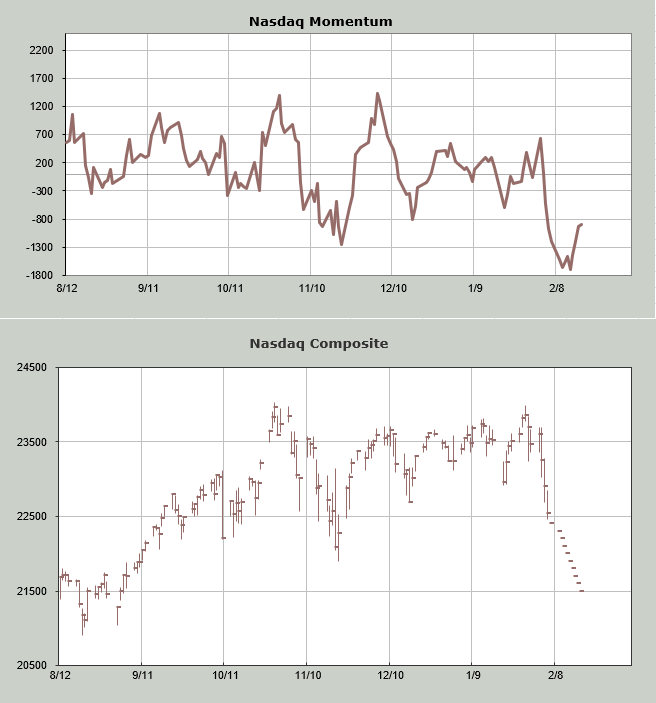
Then there is the Nasdaq Momentum Indicator. What I do here is I plug in lower closes for Nasdaq until I see the indicator stop going down and turn up. That occurs between Tuesday and Thursday next week. As a reminder, the exact day is not the focus; it is the general time frame –we’re heading into it.
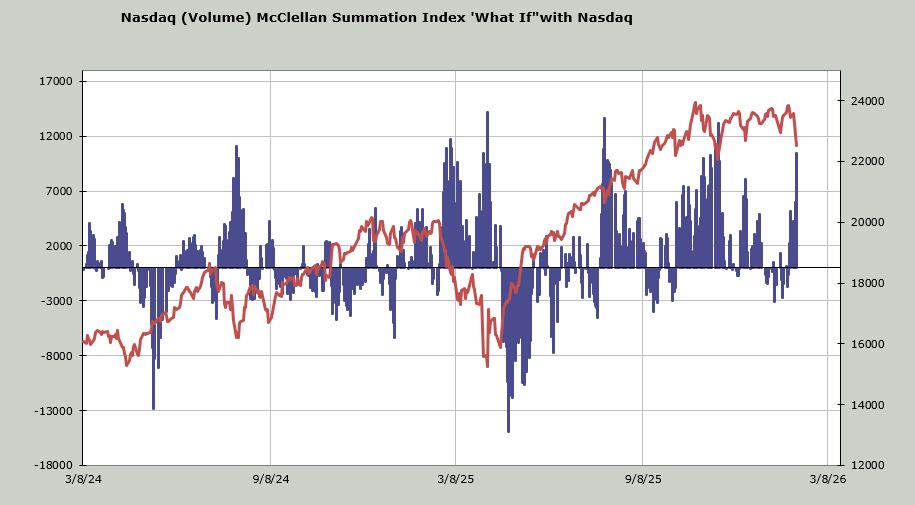
The Nasdaq McClellan Summation Index has been heading down for months now, but as of Thursday’s close, it needs a net differential of +11 billion shares to halt the decline. I use up/down volume here, so this means net volume would have to be +11 billion shares just to halt the decline. Nasdaq traded 10 billion shares on Thursday, so you can see this is getting extreme. In the past, somewhere around +12 billion was where it got oversold.
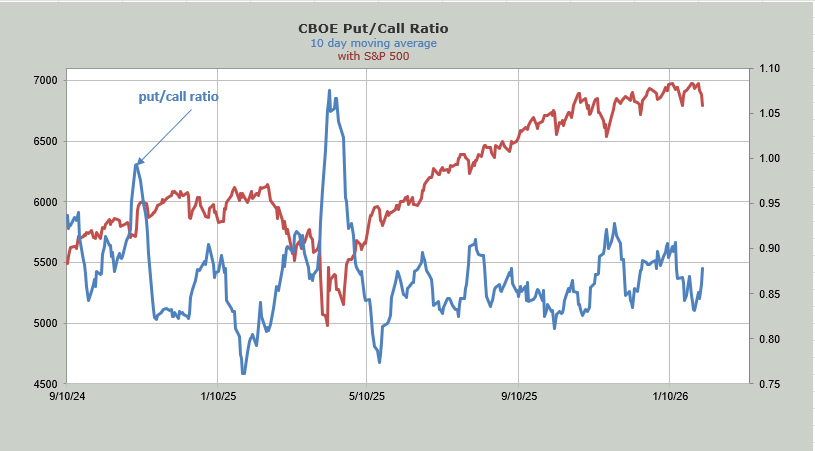
Let me note that the intermediate-term indicators are not oversold. Sentiment, using the indicators, is not bearish even though I am sure you must feel by now that everyone around you is bearish. The call buying has eased up quite a bit. The ten-day moving average of the put/call ratio has started to lift. On Wednesday, the ETF put/call ratio got to 1.7. To put that in perspective on the change, on January 27th, so just last week, this particular ratio got to .69.
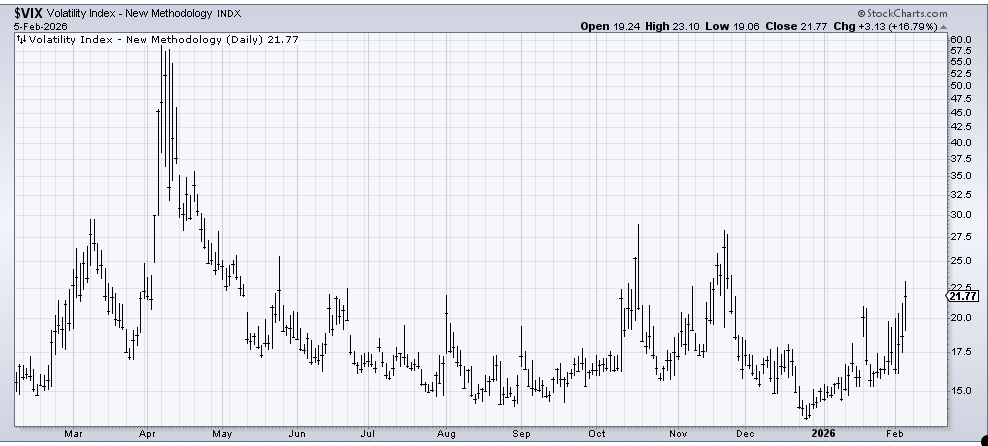
Lastly, the VIX is finally on the move. It hasn’t gotten jumpy yet, but it finally feels as if it is on its way to getting there. I think we see tech have a short-term oversold rally next week. If you look at the sentiment cycle chart, once we get to panic, we should have a bounce.