Are the S&P and Nasdaq No Longer in a One-Sided Relationship?
Here's what's happening with these two big-cap indexes, and why the ratio between them (and thus the market) has a big test coming in the next few days.
You've reached your free article limit
You've read 0 of 1 free Pro articles.
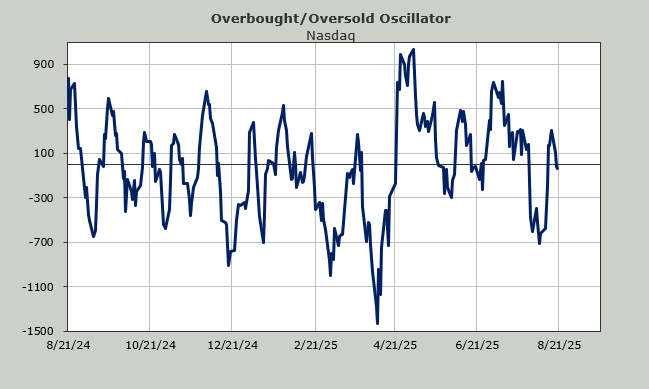
For weeks now I have noted that the indicators haven’t changed. Oh sure, a lot of stocks have stalled, some have corrected — often greatly — but that is reflected in the indicators for the most part. They have been heading down for the last six or seven weeks.
Despite Wednesday’s whack and subsequent rebound (although not enough to close the major indexes green) there has been a change we need to look at.
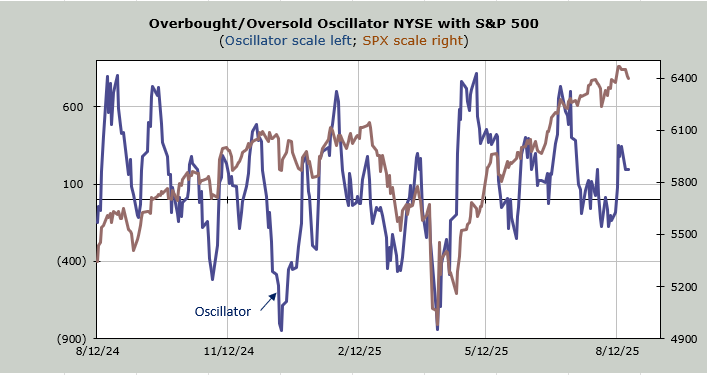
We already know that I like to look at the ratio of the SOX to the Nasdaq Composite (no higher high and pointing downward) as well as the Bank Index relative to the S&P 500 (no higher high).
There is another ratio chart I like to check in on. I know these days everyone is non-stop chatter about value vs. growth and small-cap vs. large-cap and equal weight vs. weighted, but I would like you to take a look at something less esoteric: the S&P relative to the Nasdaq. Two big-cap indexes that generally trade together. Or do they?
Ever since stocks made their lows in April, it has been a one-way street for this relationship, with Nasdaq outperforming by quite a bit. When the ratio heads down, the Nasdaq is outperforming. Notice that the last week or so the S&P is outperforming. In fact, this is the first real push upward since the lows.
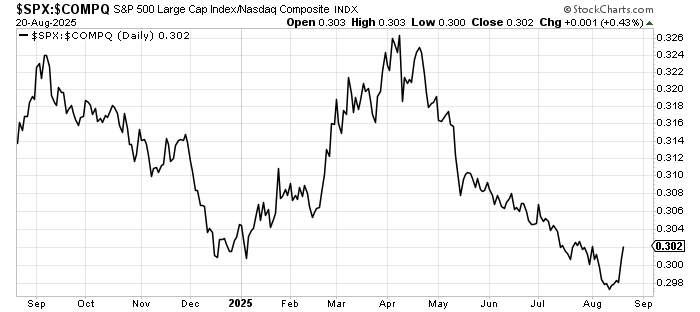
Therefore there is a change; it is in this ratio chart. Notice that it looks different this time than it looked even in early August when we saw that big whack for the employment number. My takeaway on this chart is that when it is rising (the S&P is outperforming) folks are embracing safety over risk/high beta/growth/whatever you want to call it.
It is possible this just turns south and slumps all over again but that is one strong move, such that we haven’t seen in the last five months. Notice that it took a while to "bottom" from December onward. Therefore the ratio (and thus the market) has a big test coming in the next few days: Does this turn south and give up all the gains or does it hang on to the change?
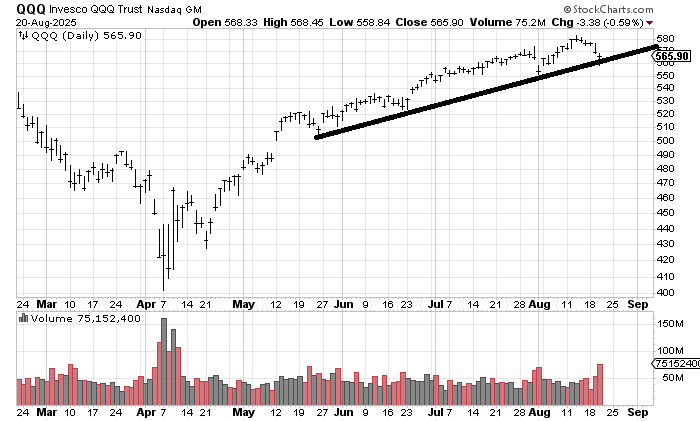
Now the QQQs did trade 75 million shares on Wednesday and they bounced off the uptrend line I drew in last time. I expect a bounce after five straight down days for the QQQs but that, too, is another change: the QQQs have not notched five straight down days all year.