Are the Indicators Confirming the Market's Highs? It's Complicated.
Let's dig in to see what the indicators are saying about the market's advance. Not all stocks are coming along for the ride.
You've reached your free article limit
You've read 0 of 1 free Pro articles.
The stock pickers/group rotation market has become more picky in recent days. The first place we see it is breadth.
Last Thursday, when the Russell 2000 was up two percent, net breadth on the NYSE was +830. For a day where small caps lead, that’s pretty pathetic, but it’s in keeping with what we’ve seen so much of lately.
On Friday, when the Russell gave back some of those gains, net breadth on the NYSE was -860. Wait a minute, if you are not very good with math, that means over two days the Russell gained about 40 points (or 1 ½ percent), and net breadth was negative. You can see it in the chart of the cumulative advance/decline line (breadth) here.
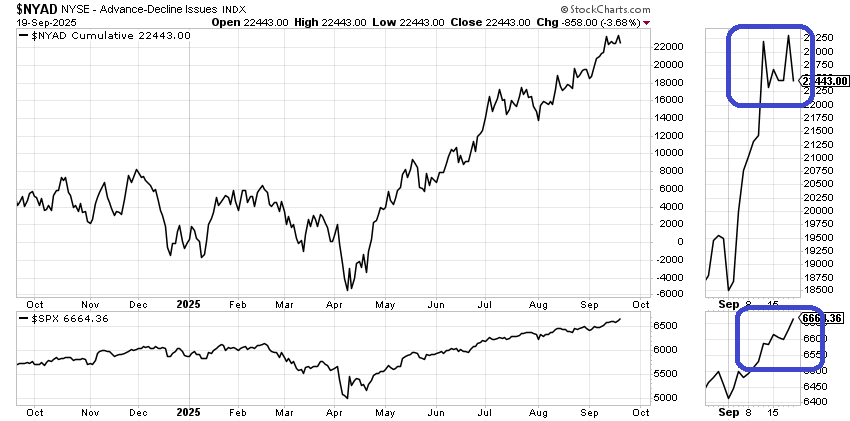
Now we’ve seen these little hiccups over the last few months, and they have righted themselves pretty quickly, but this divergence from last week is worth keeping an eye on.
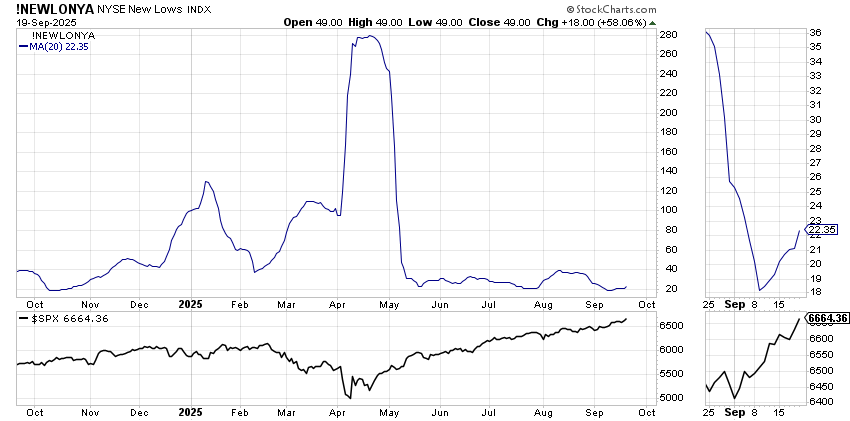
Especially since the number of stocks making new lows on the NYSE has doubled since Wednesday. The number now sits at 49, the highest reading since August, when the S&P was 250 points lower than it is now.
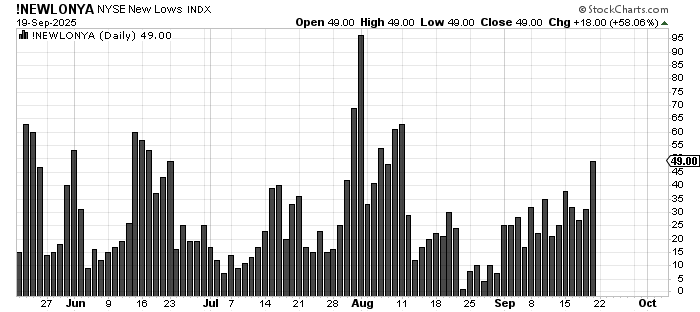
Now take a look at the 20-day moving average of the stocks making new lows. Since September 9th it has been rising. Since September 9th the S&P is up 250 points.
Yet on Friday folks decided to buy more calls in equities than they have since May. Maybe all of this action is just related to Friday’s triple witching expiration but the difference between what is going on over at Nasdaq and the NYSE is glaring.
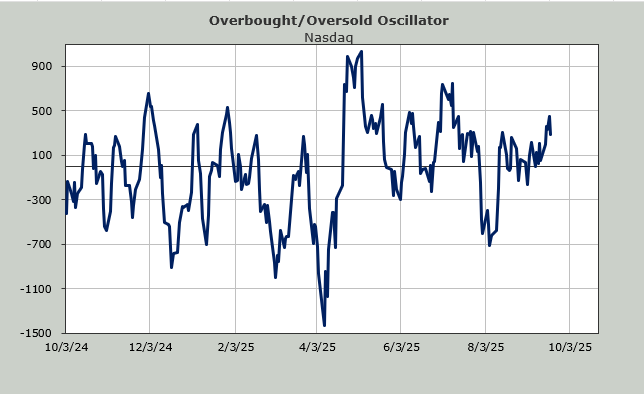
Over on Nasdaq, the net volume (up minus down) hasn't had a negative day in fourteen days. That’s almost three weeks. Well, actually, it is three weeks because there have only been fourteen trading days in September due to the Labor Day holiday.
We had a fifteen-day streak in the summer of 2024, heading into that late July peak, but this seems different than that. Back then the Mag 7 were drooping and now they are not.
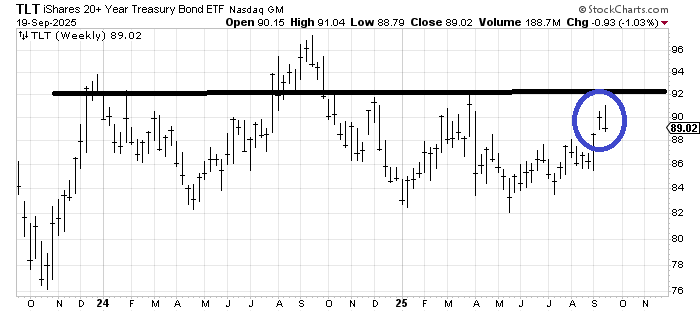
Then there are the bonds. By now, you know my view that I think that 92-ish area on TLT is the top for now. But do you realize that TLT had an outside week last week, a week the Fed lowered rates?
I am typically not a big fan of outside days or weeks in anything, although many are. An outside day is when the asset makes a higher high and a lower low vs the prior session. In any event, call it another oddity.
Nasdaq does not have nearly the same situation, as while new lows are up, they are still fewer than they were on September 8th. And as noted, breadth, using volume has been positive all month, although even Friday, it got a bit narrow with only 54% of the volume on the upside.
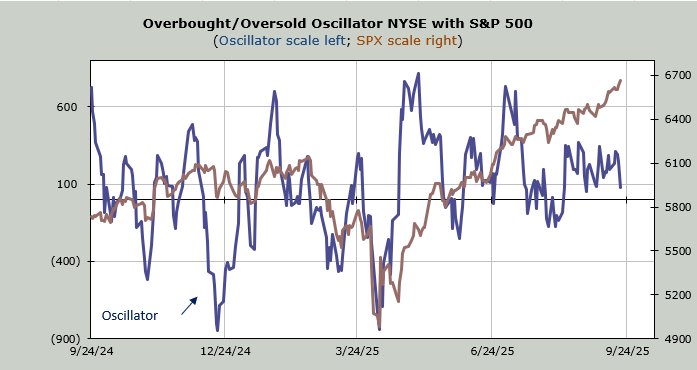
Finally, I said we’d get a little overbought late last week, and naturally that showed up only in the small caps/breadth. If we can get some follow-through on the downside, we could get oversold quickly since we are already near the zero line.