Are Investors More Fearful Than the Fear and Greed Index Suggests?
There's an error in the way that the index is calculated. What does it mean?
You've reached your free article limit
You've read 0 of 1 free Pro articles.
Let’s talk about how deep into Extreme Fear the Fear & Greed Index really is.
This morning, Fear & Greed sits at 17, down two points from yesterday’s close but up slightly from yesterday’s low.
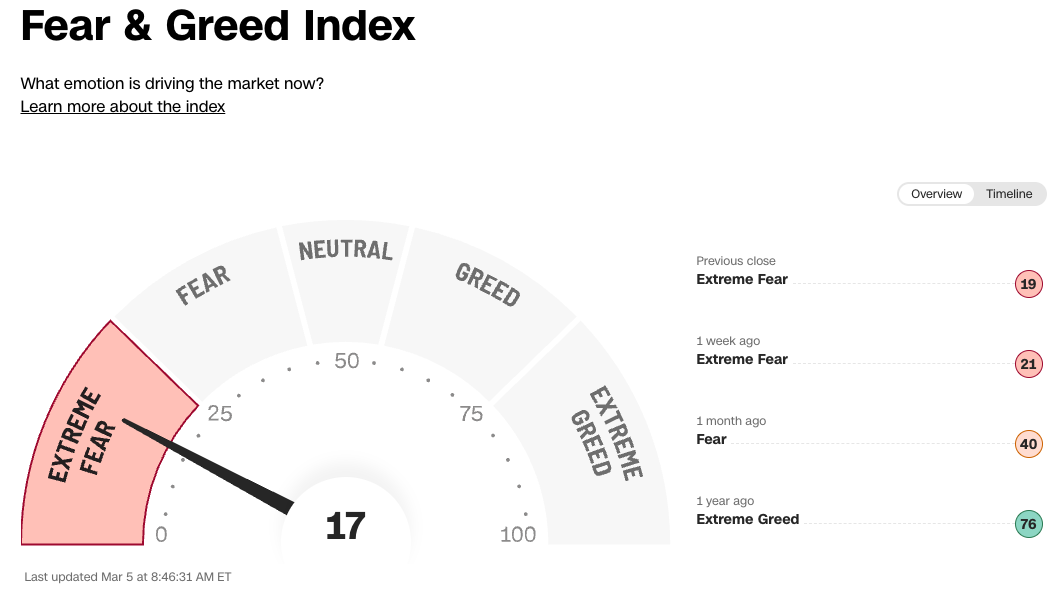
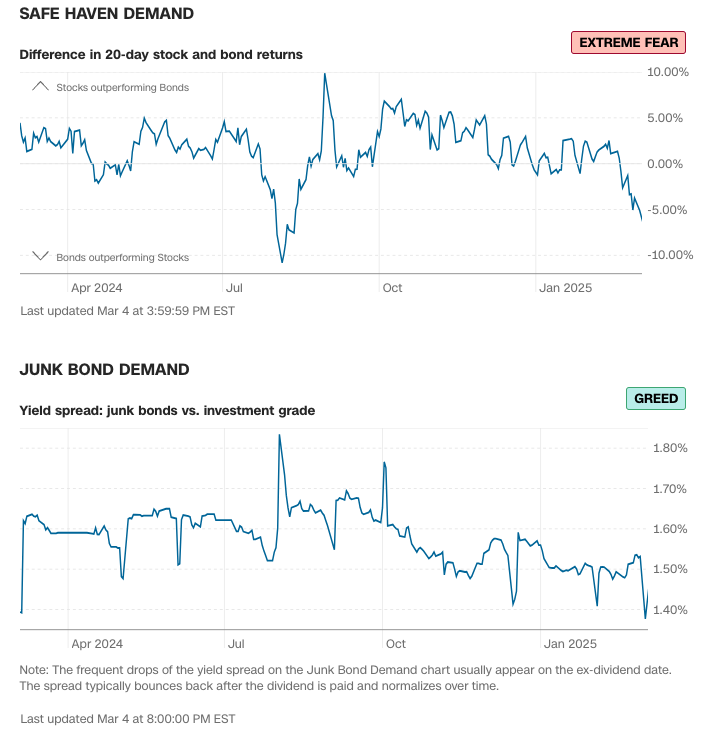
Six of the seven components indicate Extreme Fear, while one, Junk Bond Demand, indicates Greed. And that indicator is wrong.
Junk bond demand is broken. What should it say?
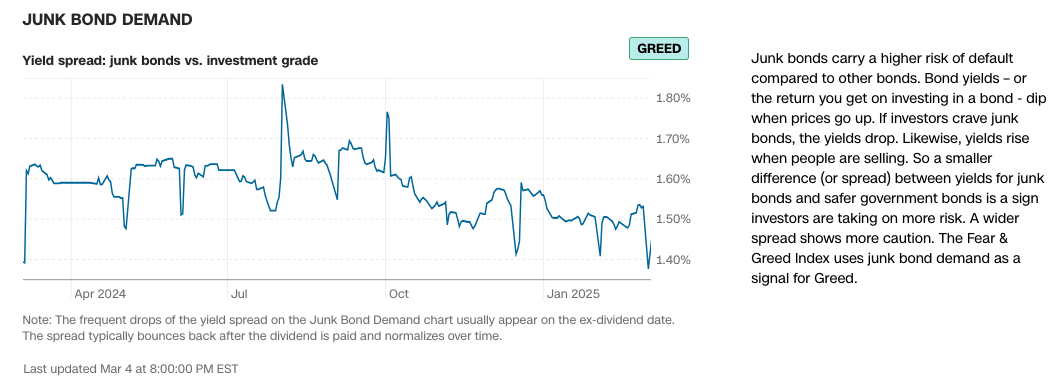
Notice those crazy spikes? Junk Bond Demand measures the difference in yield between junk bonds and investment-grade bonds using two ETFs, HYG and LQD. When these ETFs trade ex-distribution (they owe shareholders money), they drop in price by the amount of the distribution and the ratio of the two yields, which we use to compare the demand for junk bonds, spikes briefly. That happened on Monday.
When I originally created Fear & Greed, I handled this by averaging the impact of the distribution over several days. CNN hasn’t done this.
The impact of the spikes is that they create bigger extreme values in the indicator. Most of the time, it’s no big deal. But days like yesterday, it is a big deal.
So, I like to sanity check the indicator by comparing the price movement between the two ETFs.
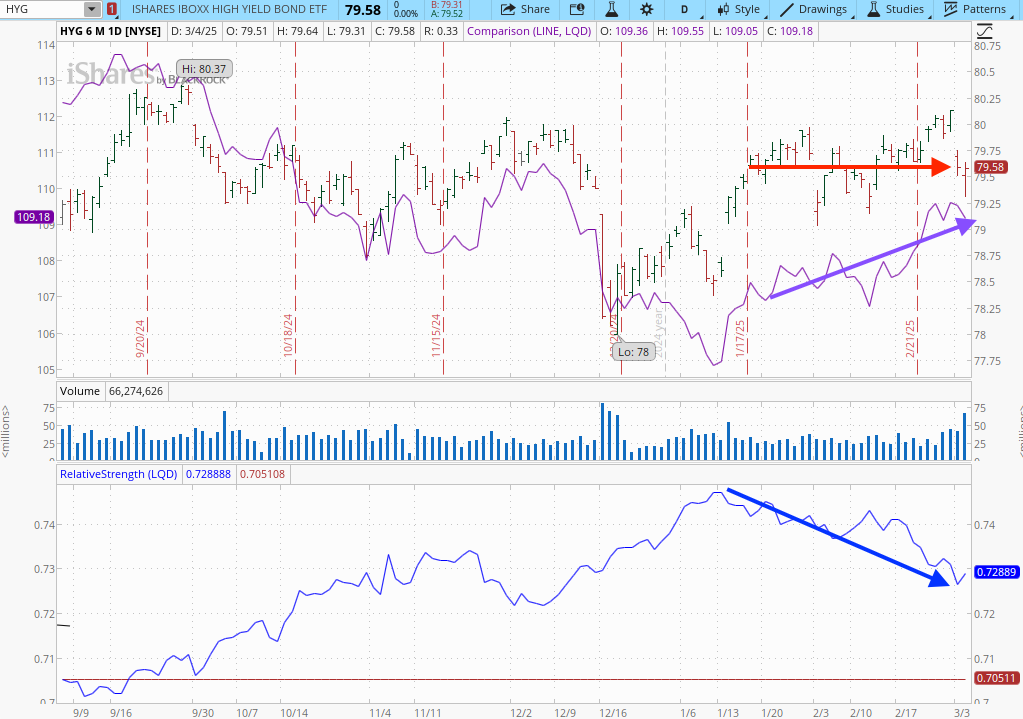
Since January, investment-grade bonds (purple line) have beaten junk (bar chart). The ratio of the two prices, in the bottom panel, highlights that clearly. Bond investors are Risk Off.
Junk Bond Demand should indicate Fear, or even Extreme Fear, rather than Greed. And that would bring the Fear & Greed Index down closer to 10.
What's the overall picture?
For the first time in a long time, all of the indicators indicate Extreme Fear.
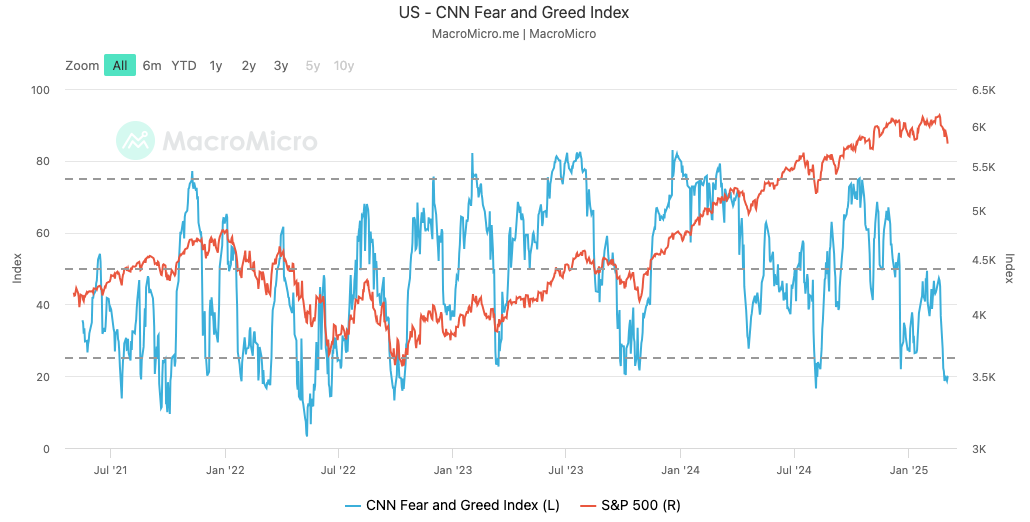
Stock Market Indicators Have Rolled Over
Market Momentum has fallen to one standard deviation below its upward sloping 125-day SMA.
Breadth has continued to roll over.
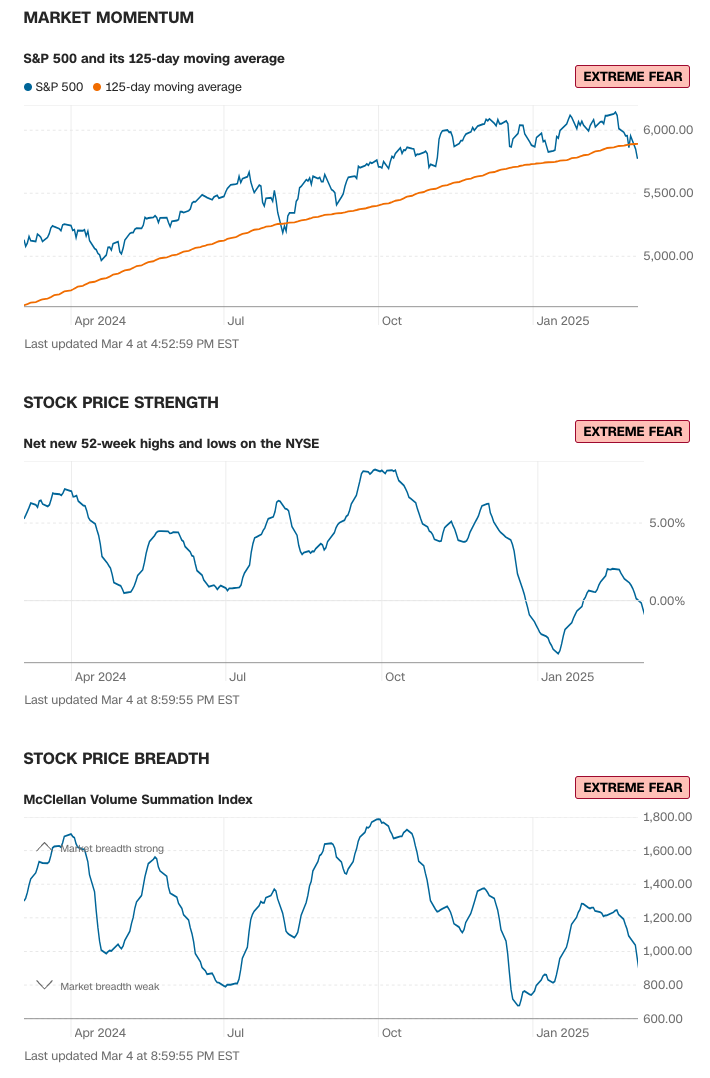
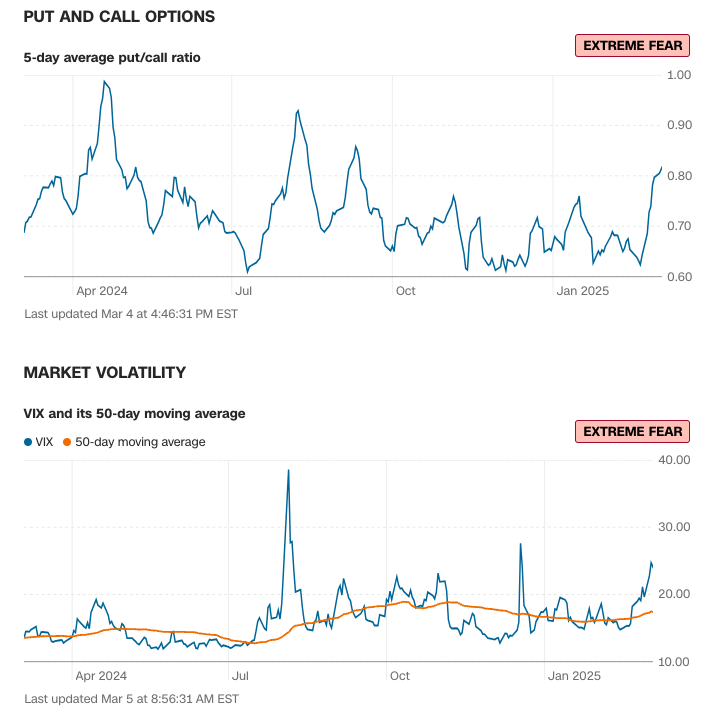
Options Indicators Have Spiked
Options, both the VIX and Put/Call ratio, have spiked as investors hedge their bets.
Bonds are Risk Off
And bonds show risk off.
Is this bullish or bearish?
In the past, when Fear & Greed has dropped below 10, it’s nearly always been a good buying opportunity-at least for a decent bounce within the next 1-month. But those were in normal times. Fear & Greed would indicate that a bounce is within reach, and with the 125-day SMA still trending upwards, that seems like a safe bet. However, these are anything but normal times.