Anecdotal Evidence of the Group Rotation
This is why the market hasn't gotten truly oversold yet.
You've reached your free article limit
You've read 0 of 1 free Pro articles.
 Stock Traders
I want to begin with some anecdotes.
About a week or so ago, I complained that we had not seen any of the Wall Street firms taking down their earnings estimates or price targets for the S&P. And then I actually saw one firm lift its target, which was bothersome to me.
But late last week, we saw Citigroup lower their weighting of US stocks. Then we saw Morgan Stanley lower their global (so not just US) stock allocation. Finally, I saw a strategist, who is really a bond guy, telling us he had become more cautious on stocks a few weeks ago. Then he started to say something about the ‘technicals’ were okay, and I will be honest, I believe he should have stopped right there. Can you imagine me talking about the yield curve and duration? You’d mute me in a minute and probably roll your eyes! This was no different.
On Monday, we saw what is the last of the Hidey Holes get sold. By that I mean the semis. Not only did they sell the semis, they sold the storage stocks, the ‘AI buildout’ stocks, and almost any other stock that had been holding up. Aha, now we’re getting somewhere!
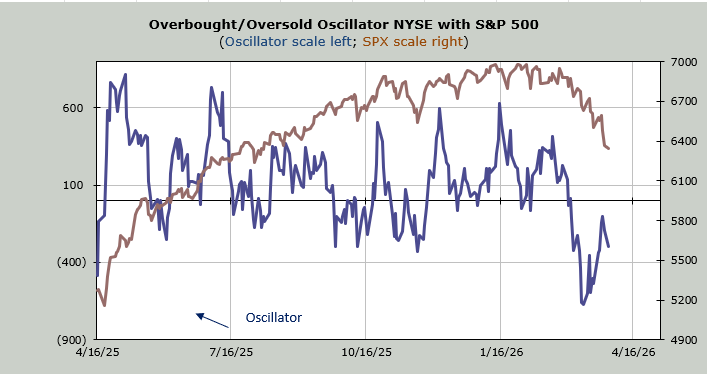
But we did not get panic. The VIX did not get jumpy.
This is because it’s just a constant group rotation. I can’t even call it the Either/Or Market because the selling just rotates, the same way the buying rotated on the way up. First, they sold the Asset Managers, then Software, then the banks/financials. Then the staples, and so on. So Monday was just a rotation out of the last of the momentum trades.
But while folks were selling those stocks, they stopped selling and maybe even bought a little software. The banks and financials have stopped going down, too. And the staples, etc.
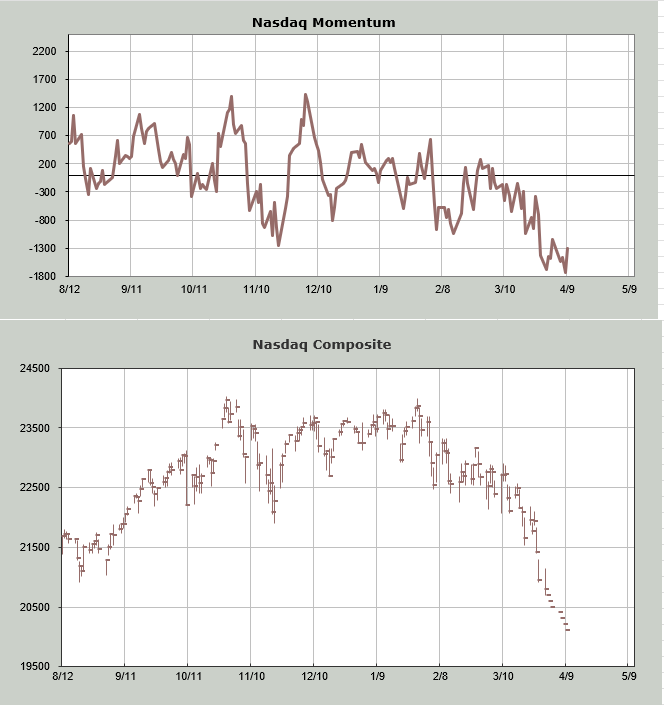
Once again, I did a ‘what if’ for the Nasdaq Momentum Indicator, because Nasdaq has now been red for three straight days. The SOX has as well. Do you realize the SOX hasn’t been red four straight days since December?
When I walk Nasdaq down in price to determine when the Momentum Indicator stops going down, the time frame comes sometime between Tuesday and next Monday. Remember, this is not meant to pick the exact day/date, just a general time frame for a short-term oversold condition.
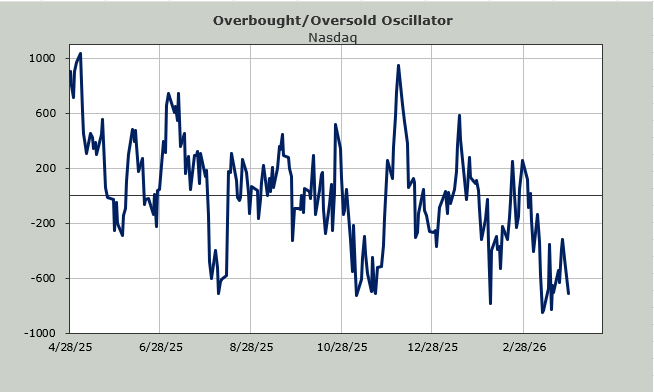
Nasdaq’s Hi-Lo Indicator is at .16 so that is oversold. And the DSI for Nasdaq is at 12.
So, just imagine if we can get one day where folks decide to sell everything, and the VIX gets jumpy, the down volume is at 90%, then it is likely that the DSI falls to single digits, and we’d have the ingredients in place for a rally. Hey, if we got that the bond strategist who fancies himself a market technician might even tell us the technicals stink now!
Or is the market just going to continue to move from group to group, just grinding downward and using up oversold readings by going sideways? I hope not.