Amazon Is Proof: You Really Can Sell a Megacap Stock
With the stock down 10% and getting oversold, and sitting at a support line, it should find some footing in the 215-220 area.
You've reached your free article limit
You've read 0 of 1 free Pro articles.
We’ve now had three down days where it really feels as if the only selling is in the 493. But let’s take a look at Amazon, which we looked at two days ago.
There is an old joke about technicians drawing lines, something about if one breaks we’ll just draw another one.
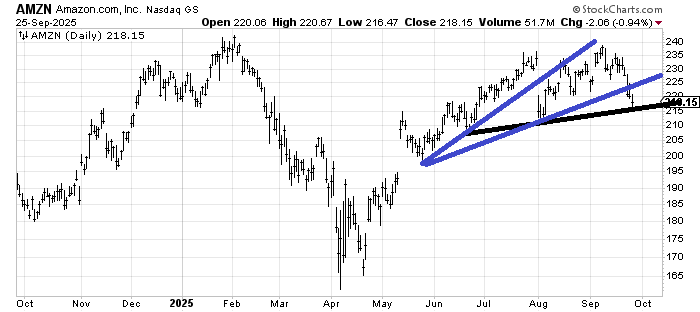
The other day I drew in the lower blue line. We clearly broke it and if you squint hard you can see that today we also broke that 220 area, which had been the lows for the past six weeks. Today I drew in the black line. The reason I drew the black line is because it is flatter than the blue ones. Consider the blue ones early warning signs.
In any event, Amazon (AMZN) is now closing in on the early August low and is now down 10% since the peak in early September. So you see, it is possible to sell a big or megacap stock!
My point here is that with the stock down 10% and therefore getting oversold, and it is sitting at a support line (black one), it should find some footing in this 215-220 area.
So what we need to watch is whether it can bounce, and if it can, can it recapture that lower blue line (around 225).
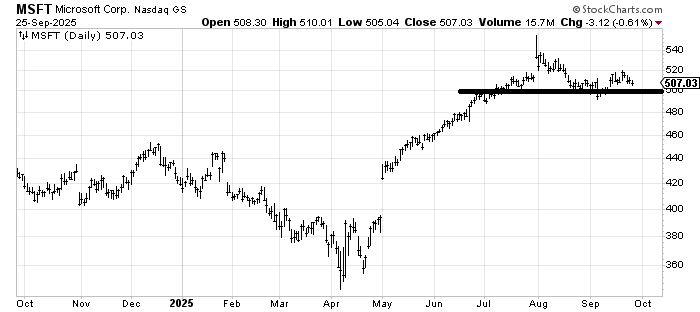
Then there is Microsoft, which hasn’t had much selling but is well below its early August high. It finds itself back at July levels. I will keep my eye on this 500-ish area, which it has held since early July.
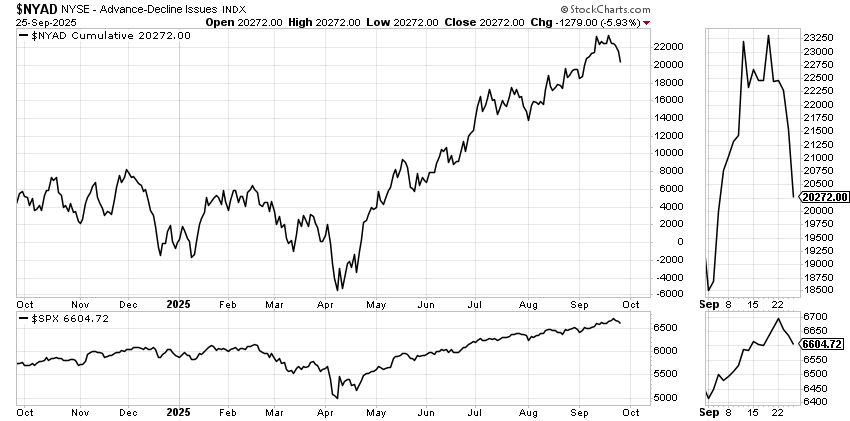
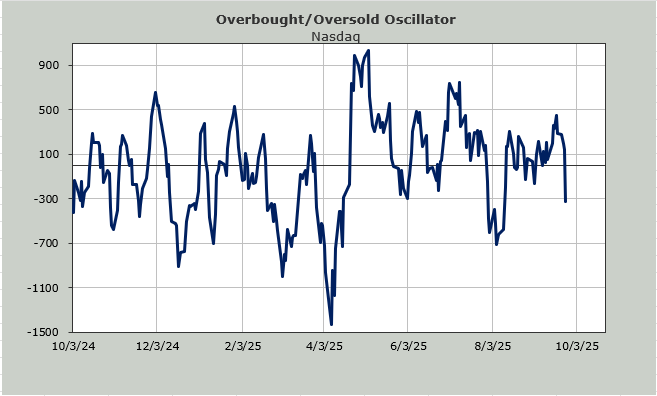
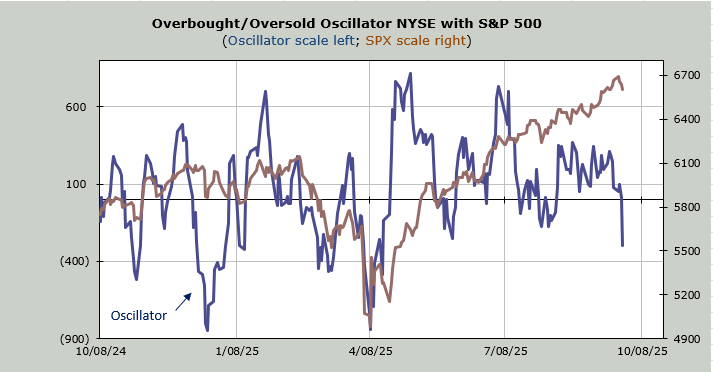
As for the indicators, once they turned they did not hold back. The Overbought/Oversold Oscillator plunged and is now lower than it was in early August. If we can get breadth negative for a few more days, I would declare this as short-term oversold late next week.
That, of course, would be in accordance with that old adage about selling before Rosh Hashanah, the Jewish New Year (earlier this week) and buying before Yom Kippur, the Day of Atonement (late next week).
The McClellan Summation Index tumbled as well. It now needs a net differential of +2600 advancers minus decliners on the NYSE to halt the decline. If it gets over +3000 it steps a toe into oversold territory.
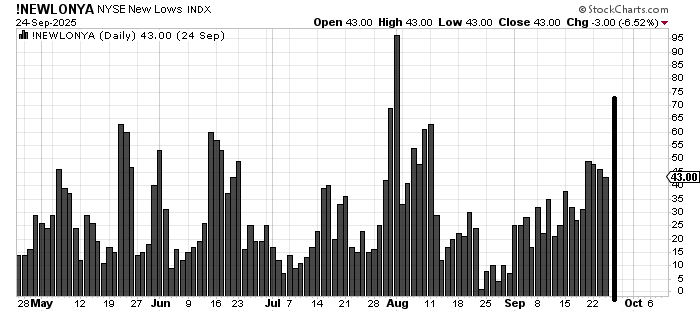
The number of stocks making new lows expanded to 72 on the NYSE. There were more new lows than new highs, something that hasn’t occurred since August. It was the same for Nasdaq. In any event, you want to see the new lows contract not expand.
When we began this week I showed the chart of the breadth of the market, noting that there was a divergence last week. That divergence has continued as the week has progressed. If you are bullish, you want the breadth to improve. If you’re bullish on the index movers, you want AMZN and MSFT to hold.