AI Stocks Are Eating the Market
A nerdy visit to the St. Louis Fed museum has me thinking about how many stocks are not rallying along with the indexes.
You've reached your free article limit
You've read 0 of 1 free Pro articles.
On Friday, I did something I would categorize as very nerdy. I visited the St Louis Federal Reserve’s Economy Museum. Don’t laugh; it’s quite an interesting place to visit!
It’s very interactive (there is a trading game you can play!) and does a good job of explaining the economy and what the Fed’s role is in it. One of the consistent themes is that the Fed tries to make the economy work for all Americans with the dual mandate of employment and inflation.
I’ve thought about that quite a bit since because one of my consistent themes in the market is that I find the market to be healthier when the majority of stocks participate, not just a handful. Yet over the last six weeks or so, the market has gotten consistently narrower and narrower. It’s almost become so obvious that I am certain my mother will call any day now and ask if I know how narrow the market is.
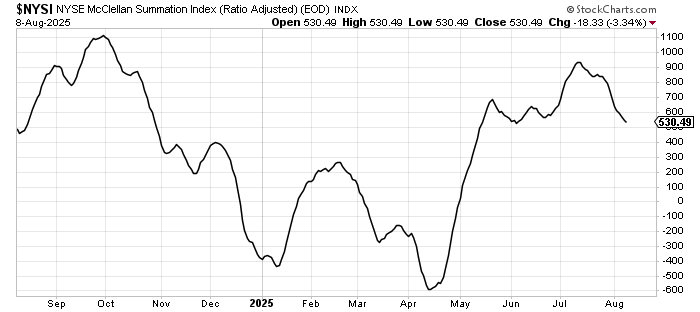
The McClellan Summation Index has been heading down since the second week of July. It now threatens to make a lower low (than the early June pullback). The indicator needs breadth to be +1100 or greater to halt the decline and a bit more than that to turn it back up.
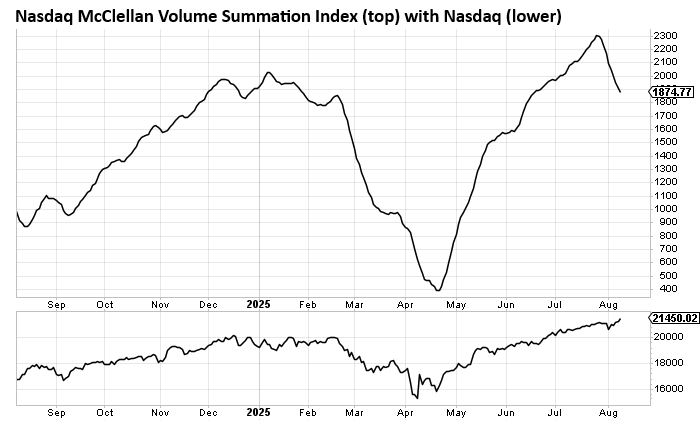
The Nasdaq McClellan Summation Index, where I use volume instead of the advance/decline line, turned down two weeks ago. Unlike the NYSE’s Summation Index, which had quite a hiccup in late May and early June, this has not taken a breather since the April low. Yet now it has turned south, and is back to levels seen in June, having given up all of July’s rally.
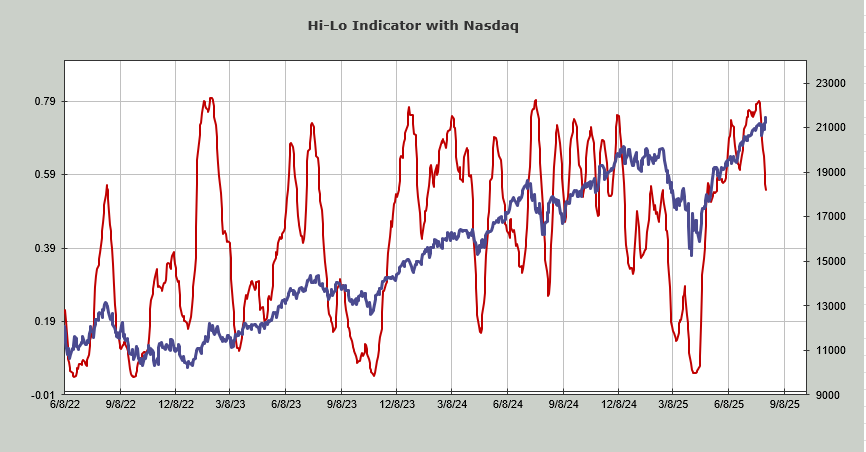
We already know the number of stocks making new highs is pathetic. The Hi-Lo Indicator for Nasdaq is now under the June low as well.
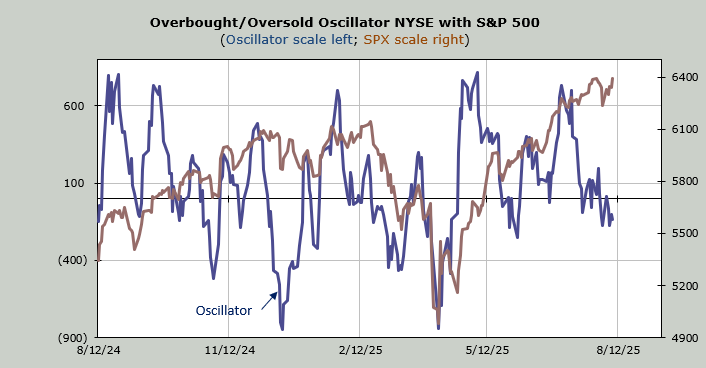
The Nasdaq Overbought/Oversold Oscillator made its high in early May. The peak in early July was well below that, and now it is closing in on levels last week in late December and early March.
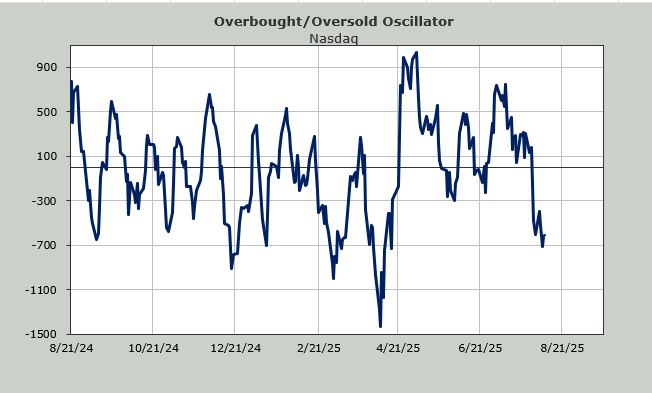
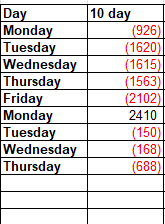
In fact, the advance/decline line for Nasdaq has been negative for nine of the last ten trading days. As we head into this coming week, we can see the ten-day moving average (the input for the Oscillator) will now drop a long string of negative numbers. Typically, I would call this oversold because as we replace a large red number with a smaller red number or even a positive one, the Oscillator should rise.
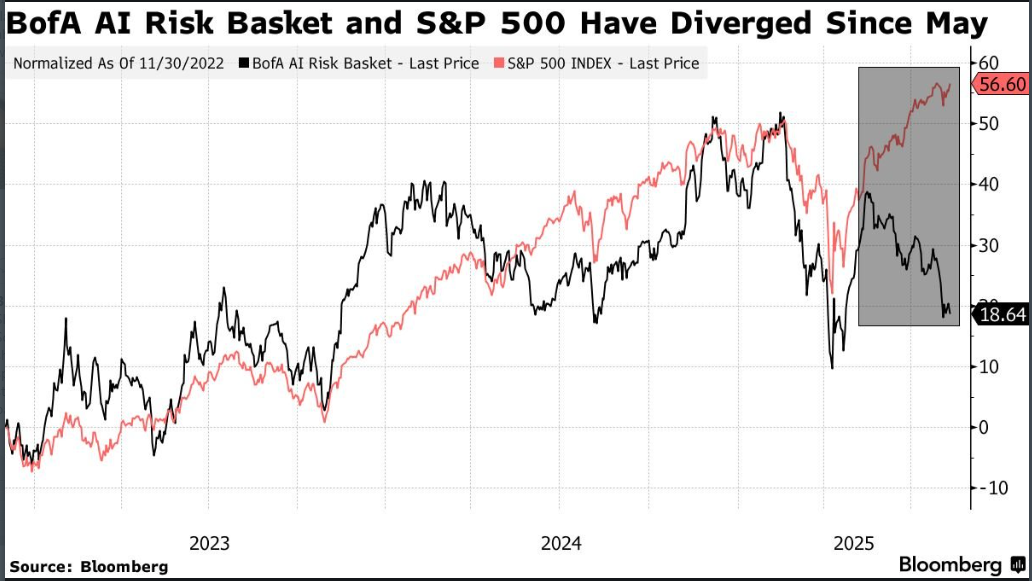
But then I came across this chart. I will note I do not know the input, but Bank of America keeps a basket of stocks they call the AI Risk Basket. It is what they consider stocks at risk of being left out because of AI. Look at that divergence since May.
All of these charts explain why sentiment was giddy in early July, but that is not the case now. When so many stocks sit it out, it’s difficult for folks to get excited and giddy.