After Two Down Days, Is There a Reason to Rally?
Let's look closely at highs, lows, and the McClellan Summation indicator.
You've reached your free article limit
You've read 0 of 1 free Pro articles.
The question of the day is, why should we rally again after we work off the overbought condition? Well, we don’t have to, but typically when we get as overbought as we got and we work it off, we have another rally attempt.
When the market rallies nine straight days, no one wants to be the trader who top-ticks it by buying on Day 10. So, they look for a pullback, which is what we are getting (Nasdaq and the Russell had their first consecutive red days in a month). At some point, the market works off the overbought reading and rallies again.
We have discussed sentiment, which in my view is getting more bullish but is not quite there yet. Imagine the market pulls back (as it has) and rallies again, can’t you just see how that would drag more folks out of the bear camp and into the bull camp?
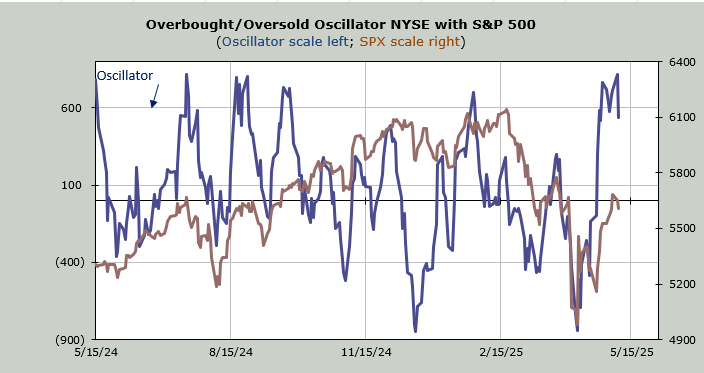
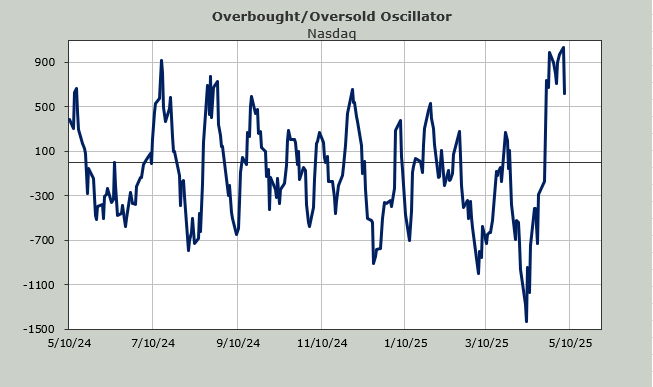
That’s why we will now turn our focus to the intermediate-term indicators. Yesterday, I showed you the table for the numbers we are dropping off the 10-day moving average of net breadth (the Overbought/Oversold Oscillator) and the 30-day moving average of net breadth. The 30 DMA, the more intermediate-term oscillator, still had red numbers to drop. By my estimation, this indicator will not get overbought until mid to late May.
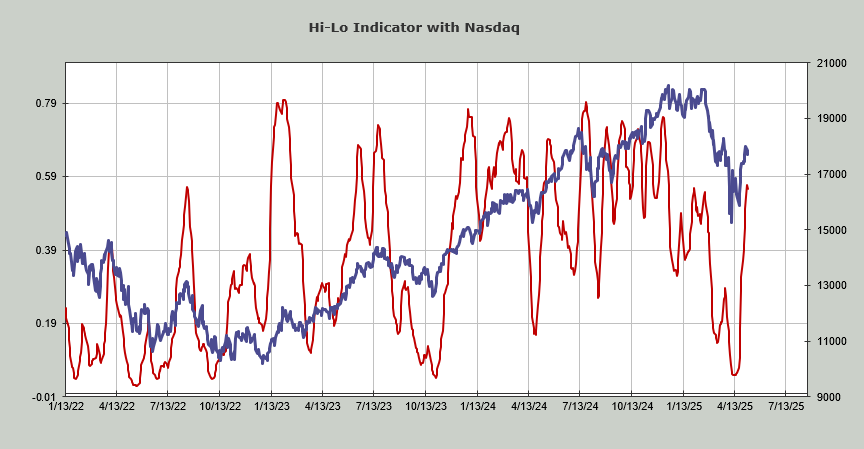
That’s why we watch the Hi-Lo Indicator. The NYSE’s Hi-Lo Indicator is still rising even though there were more new lows than new highs on the NYSE for the first time in two weeks.
Nasdaq’s Hi-Lo Indicator did tick down. You need to squint very hard to see it. It’s concerning that the number of stocks making new lows has doubled since Friday, but it’s not enough to fuss too much. If we get intermediate-term overbought and this is heading south, it is a problem.
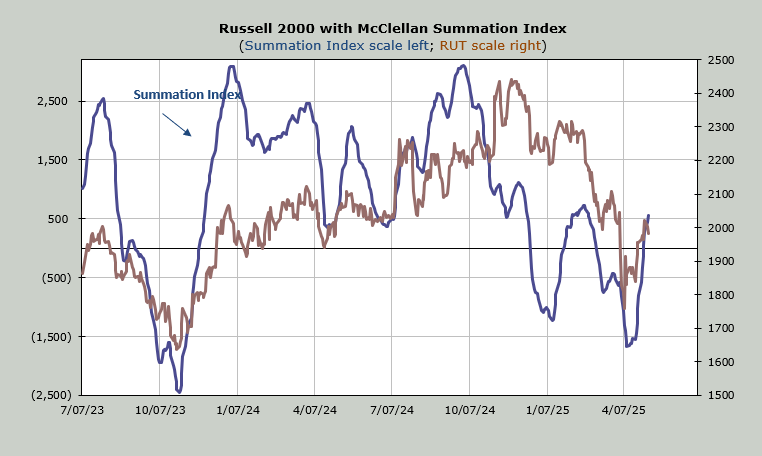
The McClellan Summation Index, a breadth indicator, is still rising. We entered the week with the indicator requiring a net differential of -4200 advancers minus decliners on the NYSE needed to halt the rise (that’s what made us overbought), and as of today, that number is -1900. It’s still a decent cushion. However, if we get intermediate-term overbought and the Summation Index has rolled over, that is a problem.
I know it’s an old technician’s song, One More Rally, but I believe time is a factor in the market, and two down days after two weeks of straight up seem insufficient to move the indicators enough for me to change my view right now. I still think we need to see a further change in sentiment, and another rally is what does that, not a market that pulls back and doesn’t rally again.