A Troubling Difference in Behavior Between the Pros and Average Investors
Here's why sentiment indicators have me concerned, a look at what's needed to repair the damage to the S&P 500, and what to expect from the market next.
You've reached your free article limit
You've read 0 of 1 free Pro articles.
It’s been one heckuva week. The ups, the downs, the wild swings, the back and forths. In the end, at least as of Thursday’s close, the S&P 500 and Nasdaq are up on the week, while the Russell 2000 is flat.
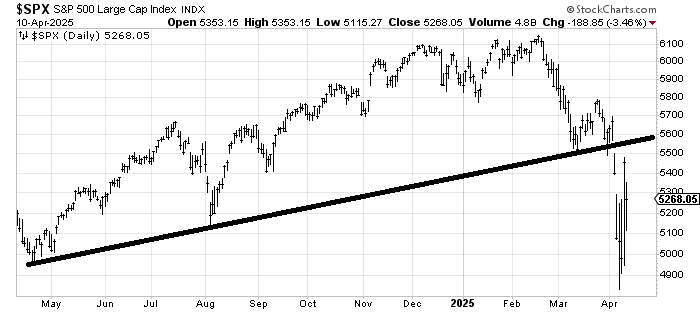
Let’s step back from the day to day for a minute and look at the chart of the S&P. It’s broken an uptrend line that has been in place for a year. Any rally back to that line is considered resistance. The concept is easy to understand: If someone got long at 5500 for the March rally, they will be looking to get back to even on a rebound back there.
But it's important to understand how so many folks are used to "V" bottoms. Heck, just look at that chart and you can see that August V bottom. I said a few weeks ago I don’t think we get a V bottom and I still don’t think so. But look at the chart and you can understand how much testing and retesting will be needed to repair the damage.
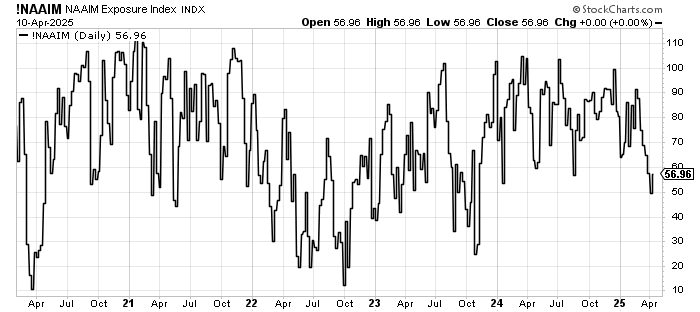
I do think hedge funds have done a lot of de-risking, but I do not think the average person has done much selling. I watched TV this week and every wealth manager that came on said it’s a buying opportunity. Then I look at the National Association of Active Investment Managers (NAAIM) and their exposure to the market.
These folks have done very little selling compared to their usual style. You can see the absolute panic during Covid all the way on the left of the chart below when they took their exposure down to 10! They did so again in the fall of 2022, but look at earlier in 2022 and notice they got to 30 in the spring and then 20 — twice — in summer. Now we can’t even get them under 40. Heck, in the fall of 2023 they got to 25.
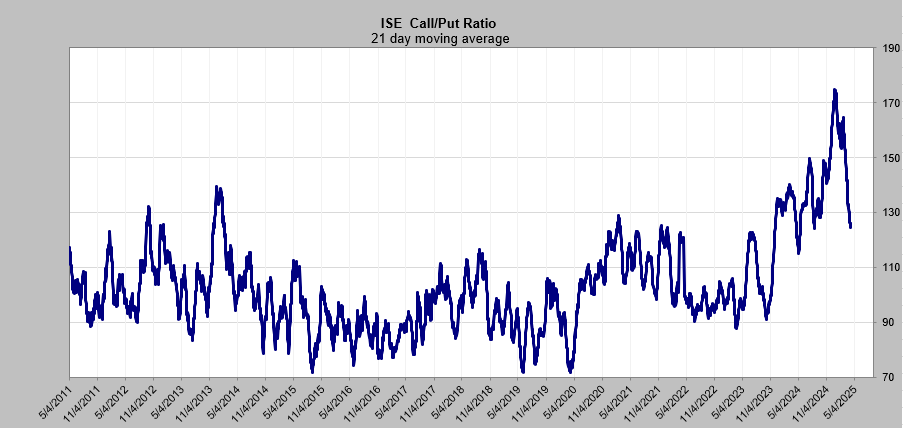
Then there is the ISE call/put ratio. This is mostly small options traders. The 21-day moving average has come down quite a lot since those lofty levels in December, but step back and look at this nearly 15-year chart, below, and you can’t tell me these options players are bearish. This ratio was hovering at 0.90 for almost all of 2022. Now we can’t even get it under 1.20.
I did not think we would give up as much as we gave up on Thursday but we did. I still think the market should try and rally again before getting overbought. But these sentiment indicators are disconcerting since the pros are starting to sound and act much more bearishly than the average investor.