A Tough Day for Nvidia, But Maybe It's Just Part of a Big Sideways Pattern
If you had only looked at trading action and not the news today, you'd wonder what all the fuss was about.
You've reached your free article limit
You've read 0 of 1 free Pro articles.
Note: I will be doing a quick video right around the open for PreMarketPrep. You can access it here: https://youtube.com/live/vnKEgnqmMso
There is an old joke that a pure technical analyst should sit in a window-less room with no access to the day’s news and just look at their charts. If you had done that on Monday, you would emerge from the room and wonder what all the fuss was about because unless you own some of that speculative stuff I have been writing about, the day was pretty standard.
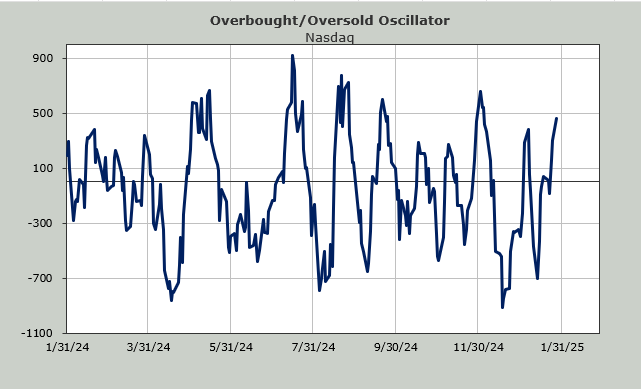
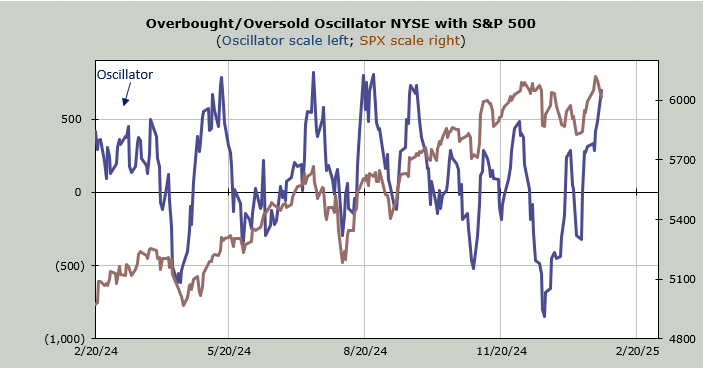
In fact, breadth on the NYSE was +400. Friday it was +350. That means the Overbought/Oversold Oscillator is now dropping nine of ten positive breadth days going forward (so yes we are overbought) but it also means that the Oscillator slipped over 500. On an intermediate term basis, that is good news because momentum did not fail at a lower high.
Another thing we learned from Monday’s trading was that the low put/call ratio for the VIX last Wednesday did matter and continues on its streak of telling us that a reading under .20 does in fact bring a bout of volatility shortly thereafter.
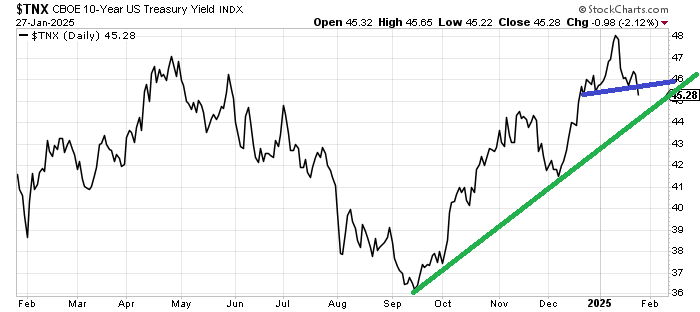
You know what else we learned? We learned that the small head and shoulders pattern I drew in—it is still only a potential pattern—for the bonds is working. Or trying to work. A break of 4.50% would make me feel a whole lot better about it since this still feels a bit tentative.
Today, I have also drawn in a green uptrend line on the chart of the yield on the Ten-Year. It comes in just over 4.40%. If we do get a further retreat in yields I expect that 4.40% area will be support on the first trip down. For the time being that is where I expect to see rates go.
What we did not see on Monday was panic. What I do think we saw was more air coming out of the speculative stuff I have been writing about. The crypto garbage has been terrible since November. The quantum stocks have also been terrible for a few weeks. And now AI has joined the crowd. I view speculation coming out of the market as a plus, even though I know it is painful.
Overall though the put/call ratio was not full of panic since it came in at .89 and therefore took the ten day moving average down another notch, now at .80. The volume in the QQQs notched up nicely to 58 million. A year ago we would have seen that over 70 million so I’m still not sure we’d call that panic.
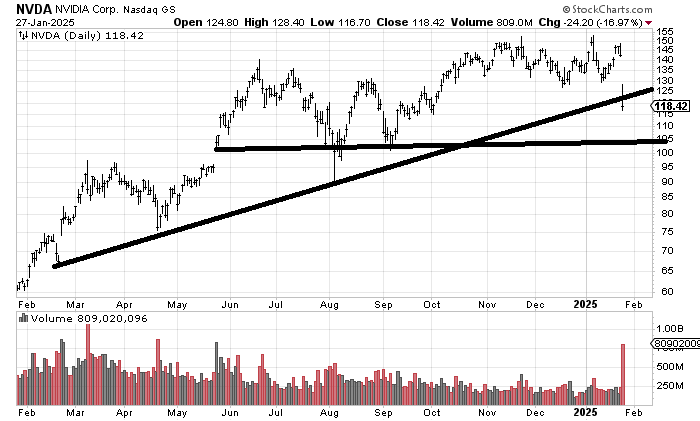
We can see if we look at the chart of NVDA the volume began drying up last summer so Monday’s volume stands out in that it is the highest since May. But remember that reversal last March, the one that got everyone excited, that had over a billion shares traded vs today’s 800 million shares traded. It’s as if folks panicked more then than Monday.
Some would call that a big break in the chart. I would say if we step back, the stock hasn’t done a thing since June, and Monday it just fell right back into the same range. It’s a wide range, but unless/until NVDA breaks those August/September lows around 100 it’s just one giant sideways.